Agent Observability in Practice: Observe Decisions, Not Machines
The more autonomous agents get, the more they need to be seen. But the traditional "logs + metrics + traces" trio barely suffices for agents — the question is no longer "where is the system slow" but "why did it do that." This hands-on guide gives a four-layer architecture (decision logs, trajectory replay, guardrail events, cost attribution), the three most common traps, and a four-week minimal rollout plan. The thesis: agent observability isn't logging — it's an auditable decision chain.
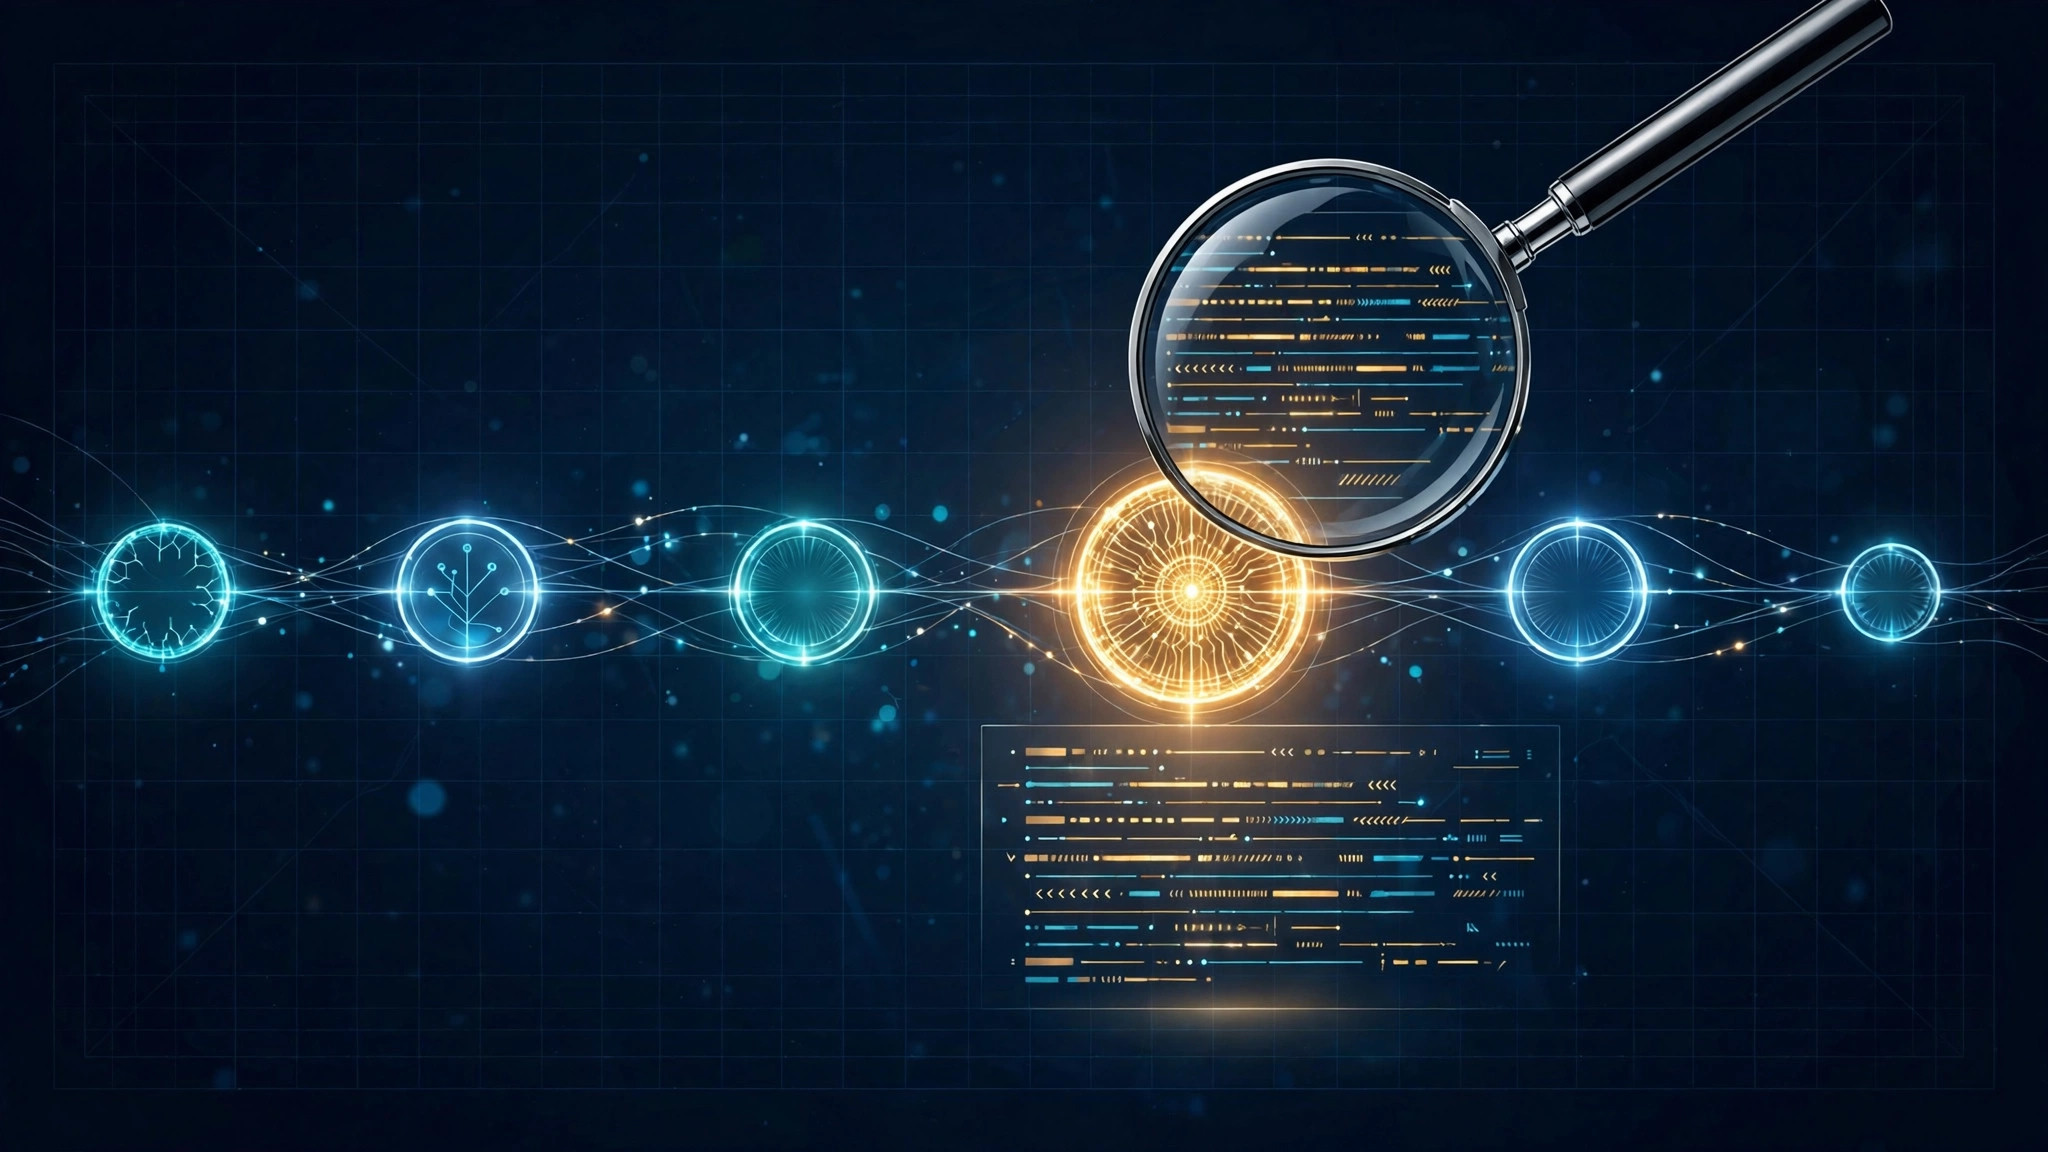
"The more autonomous agents get, the more they need to be seen." That's nearly an industry slogan in H2 2026 — OpenAI ships audits with Codex cloud environments, Cursor wires Rollouts to deployment monitoring, GitHub adds OpenTelemetry to Copilot. But slogans aside, anyone who has actually instrumented agents discovers: the traditional "logs + metrics + traces" trio barely suffices for agents. Because the question changed: no longer "where is the system slow," but "why did it do that."
This is a hands-on guide: what agent observability actually observes, how to build it, and the three most common traps. The thesis up front: agent observability isn't logging — it's an auditable decision chain. You need to answer not "what happened," but "based on what information, what judgment did it make, and was that judgment right."
Why traditional observability falls short
Microservice observability answers three questions: how fast (metrics), what broke (logs), where did the request go (traces). It assumes "code behaves deterministically" — same input, same output; you're hunting performance and exceptions.
Agents break that assumption. The same prompt run twice can produce completely different tool-call sequences; a "successful" task may hide three failed attempts and one dangerous operation (it almost dropped the database — it just didn't, in the end). Traditional monitoring sees "task succeeded, 3 minutes." What you actually want to know: what did it try along the way? Why this path? Did it do anything dangerous?
So the first principle of agent observability: record not "system state" but "the decision process." Every tool call must answer five questions: what it wanted (intent), what it saw (input context summary), which tool and parameters it chose (decision), what resulted (output summary), what it cost (tokens/time/money). Those five are the minimal data model.
The working architecture: four layers, all required
Layer 1: Decision Log. The foundation. Every time the agent makes a "choice" — picking a tool, setting parameters, deciding to retry or give up — write one structured log. Key fields: timestamp, session_id, step_id, intent (one natural-language sentence), tool, args_hash (hash of parameters; full params are too big), input_summary, output_summary, tokens, duration_ms. Don't log full prompts and full outputs — that's a cost black hole. Log summaries plus hashes; fetch full content from object storage by hash only when deep-diving.
Layer 2: Trajectory Replay. Lay out every decision of a task on a timeline, replayable like video. This is the killer tool for debugging agents — "why did it call delete at this step?" One look at the replay: oh, it interpreted "clean temp files" as "clean the data directory." Without replay, you're guessing. Implementation key: store the "rendered prompt fragment" per step, not the "prompt template" — because what the agent actually saw is the template after variable expansion.
Layer 3: Guardrail Events. Separately record everything "blocked": permission denials, sandbox interceptions, human confirmations, automatic circuit-breakers. This layer is gold for security audits and for tuning guardrails. If a guardrail fires 500 times a week and they're all false positives, the threshold is wrong; if a class of dangerous operations was never blocked, there's a blind spot. Store guardrail events separately, alert separately — never mix them into generic logs.
Layer 4: Cost Attribution. Per task, per user, per agent: tokens and dollars. Even after the 2026 token price wars, the bill remains the #1 operating cost of agent apps. Without attribution you can't know which feature burns money or which user is abusing the system. Implementation is trivial: add tokens and model fields to the decision log, then compute offline against the price sheet.
The three most common traps
Trap 1: logging full prompts, unaffordable in three months. A mid-size agent app easily generates tens of GB of logs daily. The right posture is tiered storage: structured decision logs hot for 90 days, full prompts/outputs in object storage warm for 30 days, beyond 30 days keep only hashes and summaries (cold). Need to replay a task from three months ago? You probably don't — archive in advance the ones you truly might.
Trap 2: logging "what it did" without "why." Many teams' agent logs are just tool-call ledgers: read_file called, edit_file called, bash called. When something breaks, you can't tell why it chose that file or those parameters. Mandate it: every tool call carries an intent field — the agent states in one sentence "what I'm trying to do." A few extra tokens; hours saved debugging.
Trap 3: observability and guardrails as two separate systems. The most common architecture I see: logs go to ELK, guardrails are hardcoded ifs. Result: what guardrails blocked is invisible in logs; dangerous operations visible in logs were never covered by guardrails. The correct approach is guardrails as event sources: every guardrail decision (allow/block/escalate) writes a guardrail event, correlated to the decision log by the same session_id. Only then is the full chain — "it wanted to do harm → blocked → escalated → human approved" — auditable.
The minimal viable plan: start today
If you're starting from zero, don't try to build all four layers at once. In this order:
- Week 1: Add structured logging to every tool call (intent + tool + args_hash + summaries + tokens). Your existing logging stack is fine — don't build new infra.
- Week 2: Build the ugliest possible trajectory replay page: query all steps by session_id, list them chronologically, expandable summaries. Ugly is fine; working is what counts.
- Week 3: Make guardrail decisions their own events, wired to one alert channel (alert on block-rate spikes).
- Week 4: Add cost attribution and send the team a weekly "what each feature burns" report — you'll be amazed how motivated people get about saving money.
Tooling: build or buy?
Four layers sounds heavy — building from scratch takes 1–2 engineers a month. The H2 2026 reality: most layers have off-the-shelf tools now; don't reinvent wheels.
- Decision-log layer: LangSmith, Langfuse, Braintrust are all mature, open-source and self-hostable. One selection criterion: does it support custom fields (intent, args_hash)? If not, skip it no matter how cheap — agent decision logs and LLM call logs are different things.
- Replay layer: all three above ship replay UIs — good enough. But watch the "rendered prompt" requirement: many tools default to storing templates. Confirm it stores the "expanded full input." That's the easiest thing to get fooled on by sales talk — verify hands-on in the POC.
- Guardrail-event layer: the most worth building yourself. Guardrails couple tightly to your business logic (what counts as "dangerous" differs per business); generic tools force bad fits. Build a "guardrail events table" yourself — fields: session_id, rule_id, decision (allow/block/escalate), reason. One day of work.
- Cost-attribution layer: don't buy a tool; use SQL. The decision log has tokens and model; join one table against a price sheet and your BI tool renders the reports. Token prices move fast in 2026 ($2/$10 nearly standard), so keep the price sheet as config, never hardcoded.
A real case: one replay saved a week of debugging
A real story (details sanitized): a team's agent "syncs third-party data every morning and generates a report." One day the report data was all wrong, but the task showed "success" and every log was green. The traditional approach — rerun the whole pipeline guessing — costs at least two days.
They opened trajectory replay and walked the timeline: at step 7 the agent called the data API and got "429 rate limited"; at step 8 the agent's intent read "API rate limited, falling back to cached data"; at step 9 it read a three-day-old cache file and produced a "successful" report. The problem was obvious: on "rate limit" the agent chose "degrade," but the degradation was wrong — stale cache instead of retry or alert.
The fix took 10 minutes: one iron rule in AGENTS.md — "on third-party API rate limits, exponential-backoff retry 3 times; on failure, alert and mark the task failed; never present cached data as fresh." Without replay, that bug hides for months; with replay, 10 minutes to localize. The case proves the intent field's value — without that "falling back to cached data," they'd still be guessing.
Maturity model: which level are you on?
A self-check framework for your agent app:
- L1 Naked: only the model vendor's bill; success/failure discovered via user complaints. Signature: users yell first, then you dig through chat history.
- L2 Logged: tool-call ledgers exist, but no intent, no replay. Signature: you can find "what was called," not "why."
- L3 Replayable: decision logs + trajectory replay; single tasks reviewable. Signature: "which step's which decision was wrong" localized within an hour.
- L4 Auditable: guardrail events independent; dangerous operations traceable end-to-end. Signature: security asks "what did it do last Wednesday" and you produce the full evidence chain in 5 minutes.
- L5 Operable: cost attributed to features/users, a "burn leaderboard," automatic breakers. Signature: Monday's report shows "which feature loses money," with automatic loss-stopping.
Most teams sit at L2; the goal is L4 by year-end. Don't try to jump to L5 — observability is stairs, not an elevator. Every level's ROI is positive; each step climbed pays for itself.
Going further: using OpenTelemetry semantic conventions
GitHub wiring OpenTelemetry into Copilot is no accident — in H2 2026, OTel is becoming agent observability's lingua franca. But OTel's default semantics (http.server and friends) don't suffice, because an agent's "span" isn't an HTTP request — it's a "decision."
Practical advice: model the four layers with OTel "custom spans" — each tool call a span carrying intent, tool, args_hash, tokens as attributes; the whole task chain a trace carrying user_id, task_type, total_cost. Hang guardrail events on their spans via OTel's "event" mechanism. The payoff: your agent observability plugs straight into the existing OTel ecosystem (Grafana, Datadog, all of it) — no reinvented wheels. Remember: don't invent observability protocols unless you understand them better than OTel does.
The bottom line: agent observability doesn't observe machines — it observes "decisions." Traditional monitoring asks "what's wrong with the system"; agent monitoring asks "why did it think that." Log the decision chain, make it replayable, auditable, and billable, and you hold the entry ticket to operating agent apps in H2 2026. Remember: the trustworthiness race has started, and its foundation is "everything is explainable."
Related articles

Long tasks die three ways: context explosion, process death, or human kill — all voiding your progress. This guide gives you three checkpoint layers: commit discipline for code, data snapshots for data, phase summaries for process — plus idempotent design and a monthly 10-minute recovery drill. Ctrl+C becomes a hiccup, not a disaster.

It's 1 a.m. You've pasted the same error to the agent six times; each time it says fixed, each time it isn't. That's doomcoding: the doom-scrolling habit applied to AI coding. This guide explains the concept, three signals to spot the loop, what four studies say about it, and a five-step escape — the agent does the typing, you do the reading; get the order right and you keep both speed and safety.
The third time you run the same multi-step process, stop copy-pasting prompts. This guide covers the upgrade signal for workflow-as-code, four design building blocks (sequence/parallelism, structured handoffs, cross-verification, human checkpoints), a worked "release check" example — code owns the process, agents own the judgment — plus three anti-patterns.