The Service Is Up but Users Can't Get In: Health Checks and Readiness Probes for Vibe Projects
A successful deploy is not a usable service: how liveness, readiness and startup probes divide the work, how far to check each dependency, how to set platform parameters, and how to keep probes from becoming a new failure source.
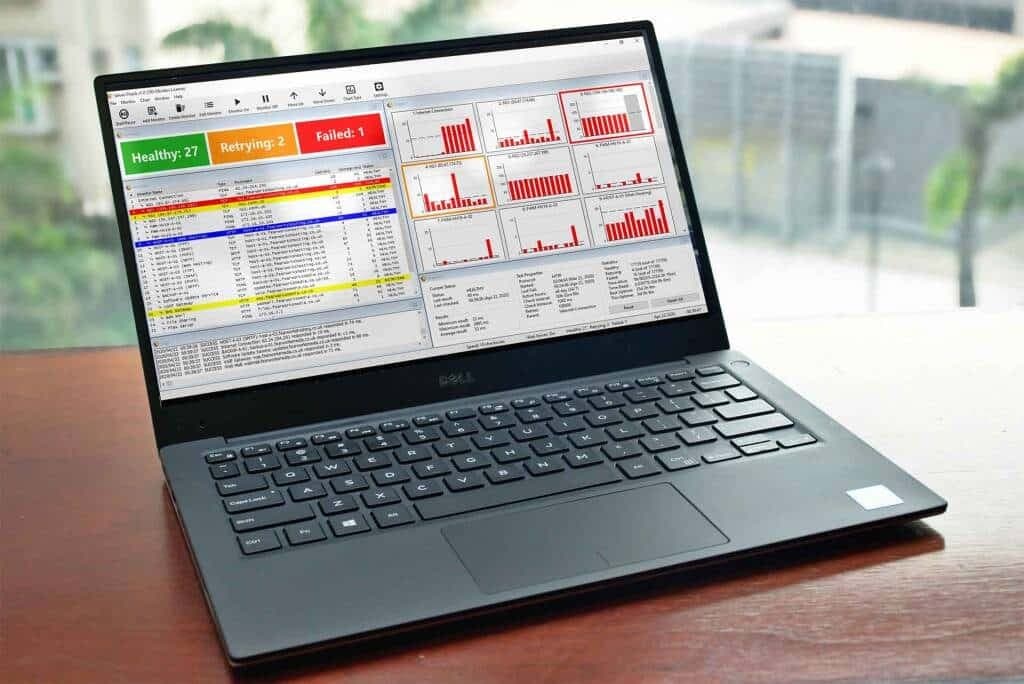
The Deploy Succeeded, but Users Can't Get In: A Lesson That Feels All Too Real
Start with a fictional teaching example. "Cloud Notes" is a small note-taking app maintained by one person. One evening a new version shipped: the pipeline was all green, the "deployment successful" message popped up, and the maintainer wrote "shipped" in the group chat. Ten minutes later users started reporting that the app would not open — the page just kept spinning. The maintainer checked the server: the process was running, the port was listening, CPU looked normal. The service was "alive". One layer deeper, the truth came out: the new version had to run a database migration on startup, and the migration was stuck. The service was not ready to take requests at all. But the load balancer did not know that, and kept sending users to it — one failure after another. Only after the maintainer manually pulled the machine out of the load balancer did things recover. Between "deployment succeeded" and "service usable", there was a check nobody had built.
That is the problem health checks exist to solve: whether a service is "alive" and whether it can "do work" are two different things. A running process does not mean the database is reachable; a reachable database does not mean the cache and the queue are ready; everything ready does not mean it can survive the next traffic spike. A health check fits a service with three gauges: is it alive, can it work, can it still hold up — and each gauge maps to an action: keep the living, hold traffic from the unready, and sound the alarm for the struggling. This guide is about designing those three checks for vibe projects: how liveness, readiness and startup probes divide the work, how far to check each dependency, how to set the platform parameters, and how to keep the probes themselves from becoming a new source of failure. All examples below are fictional teaching examples; the app names and numbers are simplified for illustration.

1. Three Separate Questions: Alive, Able to Work, Able to Hold Up
Before writing anything, separate the three questions. They map to three different checks, and mixing them up is the root of most health-check accidents. A liveness check answers one question only: is this process still alive — not deadlocked, not stuck in an infinite loop, not frozen by memory exhaustion? If the answer is no, the correct action is to restart it. A liveness check must be light, fast, and look only at the process itself: return 200 and be done. It must never depend on the database, the cache, or any external service. A service whose database is down but whose process is fine gains nothing from a restart — it will only get stuck again during startup.
A readiness check answers a different question: can this service take traffic right now? It checks what the service needs in order to work: can it reach the database, is the cache responding, has the key configuration loaded, has the startup migration finished? If the answer is no, the correct action is "don't send it traffic yet" — not a restart. The last thing a service needs while it is warming up or a dependency is recovering is a restart. Many teams run liveness checks but no readiness checks, and the result is that a new version starts taking users before its migration has even finished.
The third is the startup check, which answers "how far along is startup itself?" Some services start slowly: loading a large model, warming a cache, running a migration that takes minutes. The startup check buys patience during that window: it tells the platform "it is still starting, don't kill it just because it hasn't responded yet". Without one, a slow-starting service gets killed and restarted over and over at every deploy and never comes up at all. In one sentence: the startup check covers "can it start", the readiness check covers "can it take traffic", and the liveness check covers "is it dead".
| Check | Question it answers | Action on failure | May depend on external services? |
|---|---|---|---|
| Liveness | Is the process still alive? | Restart the process | No — itself only |
| Readiness | Can it take traffic now? | Stop sending traffic, wait for recovery | Yes — check key dependencies |
| Startup | How far along is startup? | Keep waiting, don't kill it yet | Yes — check the startup steps |

2. What a Readiness Check Should Check: List Every Dependency Separately
The easiest way to write a readiness check wrong is to make it one vague "is everything fine?" The right way is to list everything the service depends on, check each one separately, and report each result separately. Database, cache, object storage, message queue, third-party APIs — whichever one fails, the readiness check says which one, and the reason goes into the logs. That way, when something breaks, there is no guessing: the log says "database connection timed out after 3 seconds" instead of a vague "service unhealthy".
Each dependency check must be light. Check the database with SELECT 1 or its equivalent — never a full-table COUNT(*). Check the cache with a PING or by reading a tiny probe-only key — never by reading business data just to test the connection. Check object storage with one HEAD request to see whether the bucket is there — never by downloading a file. A check should finish in tens of milliseconds, with a short timeout, say 2 to 3 seconds: a dependency that has not answered in 3 seconds will time out on real requests too, so waiting longer buys nothing.
Then decide: which dependencies, when down, should take the service out of rotation — and which ones should only trigger degraded service? If the payment service is down, the ordering service mostly cannot take orders, and taking it out is right. But if the recommendation API is down, the product list can simply hide recommendations and keep selling — the readiness check should not fail because of it. Sort dependencies into two tiers: hard dependencies (the service cannot work without them) go into the readiness check; soft dependencies (the service can degrade gracefully without them) stay out of it and go into monitoring alerts instead. The sorting rule is not technical — "can it connect?" — but business: "can the user still complete the core action?"
// Readiness check: each hard dependency checked separately,
// and a failure names the dependency that failed
// GET /readyz
async function readiness(req, res) {
  const checks = {};
  checks.db = await checkDb();       // SELECT 1, 2s timeout
  checks.cache = await checkCache(); // PING, 1s timeout
  // The recommendation API is a soft dependency: monitored, not readiness-blocking
  const ok = checks.db.ok && checks.cache.ok;
  res.status(ok ? 200 : 503).json({ status: ok ? "ready" : "not-ready", checks });
}
3. Probe Parameters: Give It Enough Patience, but Not Unlimited Patience
A probe is not done once it is installed. Four parameters decide how it behaves in a real failure: how often to check (period), how long to wait each time (timeout), how many failures before declaring it dead (failureThreshold), and how long to wait after startup before checking (initialDelay). Set these from the service's real startup time, not from copied defaults. A service that needs 40 seconds to start, with an initialDelay of 5 seconds, is telling the platform "kill it if it is not ready 5 seconds after starting" — it will be killed by mistake at every deploy.
Here is a starting set a one-person team can copy directly, then tune by measurement. Liveness: every 10 seconds, 3-second timeout, restart after 3 failures, start checking 15 seconds after launch. For a slow-starting service, add a startup probe: every 5 seconds, 3-second timeout, up to 120 seconds of waiting — and liveness must not act until the startup probe passes. Readiness: every 5 seconds, 2-second timeout, pull it out of rotation after 2 failures, put it back after 1 success. Pulling out should be more decisive than putting back: two failures to pull, one success to restore. Traffic coming back a little slowly is fine; traffic sent into a half-dead service costs far more.
The parameters also have to match the deployment setup. With Docker HEALTHCHECK, remember the check runs inside the container, so whatever it needs — curl, for instance — must be installed in the image, or the check fails forever. With Kubernetes, livenessProbe and readinessProbe are two separate configurations: do not hang the same endpoint on both. The readiness endpoint checks the database; the liveness endpoint returns 200; write them as two separate handlers. The reverse proxy adds another layer of health checking: an Nginx or load-balancer check usually runs less often than the Kubernetes one, so pulling a machine out takes a beat longer. That is normal — do not chase speed by setting the interval to 1 second. One check per second across dozens of machines is a small load test aimed at your own service.
# Kubernetes: liveness looks only at itself, readiness checks hard
# dependencies, startup gets plenty of patience
livenessProbe:
  httpGet: { path: /healthz, port: 3000 }
  initialDelaySeconds: 15
  periodSeconds: 10
  timeoutSeconds: 3
  failureThreshold: 3
readinessProbe:
  httpGet: { path: /readyz, port: 3000 }
  initialDelaySeconds: 5
  periodSeconds: 5
  timeoutSeconds: 2
  failureThreshold: 2
startupProbe:
  httpGet: { path: /healthz, port: 3000 }
  periodSeconds: 5
  failureThreshold: 24  # wait up to 120 seconds for startup
4. Don't Let the Probe Become the Failure: Keep Checks Light, Cached and Rate-Limited
The most ironic health-check accident is the check itself bringing the service down. It has really happened: a readiness check ran a full-table query against the database every time, the load balancer called it every 5 seconds, and ten machines together added dozens of heavy queries per second. Or a probe endpoint had no rate limiting, a scanner found it, and hammered it hundreds of times per second until the service spent its whole connection pool answering probes. A probe is the service's most frequent visitor — it must be lighter than any business request.
Three rules prevent this kind of accident. First, cache the check results: actually probe each dependency once every 2 to 3 seconds, and answer probe requests in between from the cache. Load balancers and Kubernetes only probe every few seconds anyway, so a 2-second-old answer is not meaningfully stale — but it cuts database pressure from "one query per probe" to "one query per 2 seconds". Second, probes only read, never write: no logging to the database inside a probe, no migrations, no messages sent. Third, rate-limit and isolate the probe endpoints: give them their own lightweight route, skipping the auth middleware and the business logging middleware. If you worry about external scanners finding them, expose the probe port to the internal network only, or allow only the load balancer's and Kubernetes' IPs.
One more thing that is easy to overlook: what the probe returns. A small JSON object is enough — status, each dependency's result, and how long the check took. Never return sensitive information in a probe response: version numbers, internal IPs, database connection strings, error stack traces. Probe endpoints usually have no auth, so whatever they return is effectively public. A version number belongs on a separate, authenticated endpoint, or as a short identifier in a response header.
5. What Happens After a Failure: Tiers, Degradation and Drills
A probe's value is not that "everything is green on a normal day" — it is that "when something breaks, the right thing happens automatically". Start with tiers. A readiness failure should pull traffic automatically, with nobody needing to get up at night and click a button. A liveness failure should restart the process automatically. What needs a human is repeated failure: the same service restarting three times in an hour, or readiness failing for more than ten minutes without recovery — that is when you page someone. Alerts need tiers too: things that can wait until morning go to the group chat; only things that need action right now get a phone call. Page people for every failure, and within three months nobody answers the phone at all.
Then degradation. Once a readiness check has pulled a service out of rotation, the service itself should know "I am in degraded mode". If the recommendation API is down, the product page hides recommendations. If the image service is slow, return a placeholder first and retry in the background. If the queue that write operations depend on is full, accept the request, store it locally, and replay it once the queue recovers. Degradation is not "muddling through somehow" — it is a second path designed in advance: every soft dependency gets a matching fallback behaviour and fallback copy, written in code rather than kept in someone's head. Degradation that was never designed is the same as no degradation.
Finally, drills. Once the health checks are written, break them on purpose and watch whether the whole chain actually moves. It does not need to be complicated: in staging, stop the database for 30 seconds and see whether the readiness check turns red within 10 seconds, whether the load balancer pulls the traffic, and whether traffic comes back by itself after recovery. Then simulate a deadlocked process and see whether the liveness check restarts it on time. Write down the timings at each step: seconds from failure to traffic being pulled, to the alert, to recovery. Those three numbers are the true quality of the health-check setup — more honest than any document.
6. Don't Blur Health Checks, Status Pages and Monitoring Into One Thing
Health checks, status pages and monitoring are three different tools, often mashed together until none of them is done well. A health check is for the platform: the load balancer and Kubernetes use it to decide "who gets traffic, which process gets killed". It must be fast, light, and answer only "working or not". A status page is for users: when the service is down, users go there to see "what is happening and when it will be back". It must be written in plain language, updated promptly, and expose no internal detail. Monitoring is for the team: curves of CPU, memory, error rate and latency, used to find the root cause when something breaks.
Draw the boundaries clearly and the workload actually shrinks. A probe endpoint returns only 200 or 503 — it does not need to carry a pile of metrics. A status page is updated by a human or an on-call process, not driven by probes. Monitoring metrics are collected through a dedicated metrics endpoint (such as /metrics), with a sampling rate set separately from the probe frequency. A common anti-pattern is stuffing all the monitoring metrics into the readiness response: tens of kilobytes per probe, pulled every 5 seconds by the load balancer, with bandwidth and parsing time wasted on information nobody asked for. Another is using monitoring alerts as a substitute for readiness checks: monitoring takes minutes to notice a problem, a readiness check takes seconds — by the time the monitor pages you, users have already lost minutes of requests.
7. A Landing Order for Vibe Projects: Working First, Polished Later
A one-person team does not need the full setup on day one. Follow this order; every step pays for itself. Step one: add two endpoints. /healthz returns 200 and nothing else; /readyz runs a SELECT 1 against the database. Ten minutes of work, and it solves the most painful problem — "the deploy succeeded but the service is unusable". Step two: wire both endpoints into the platform: a HEALTHCHECK in Docker, livenessProbe and readinessProbe in Kubernetes, and a health-check path on the load balancer. Step three: split soft and hard dependencies, and write the degradation path for the soft ones. Step four: add the startup probe to stop slow-starting services being killed by mistake. Step five: cache check results, clear sensitive information out of probe responses, and wire up alerts for repeated failures.
Verify after every step; do not save all the testing for the end. After changing /readyz, stop the database by hand and watch it turn red. After wiring the Kubernetes probes, ship a release and check that new pods only take traffic once they are ready. After adding degradation, cut the recommendation API and check that the page still sells. Health checks are cheap to verify and expensive not to — invisible on an ordinary day, and discovered on release night.
8. Pre-Launch Checklist
Here is a checklist you can tick off directly. One: are /healthz and /readyz separate endpoints, with the liveness endpoint looking only at the process itself and depending on no external service? Two: does the readiness check list each dependency separately, so the logs show at a glance which dependency failed? Three: are hard and soft dependencies tiered, so a soft dependency going down cannot wrongly pull traffic? Four: are the four probe parameters set from the service's real startup time, with a startup probe for slow starters? Five: are check results cached, and do probe endpoints skip the auth and business-logging middleware? Six: does the probe response contain anything that should not be public — version numbers, internal IPs, connection strings? Seven: are alerts for repeated failures wired up, and have you drilled it — stopped the database once, stalled a startup once — and watched the whole chain move as designed?
If any item on the list has no answer, the health checks are not done yet. Whether a service is healthy is not measured by how steadily it runs on a good day, but by whether the platform can make the right call within seconds when something breaks: pull the traffic that should be pulled, restart the process that should be restarted, page the person who should be paged. Ask the three questions separately — alive, able to work, able to hold up — answer them separately, and a probe stops being decoration and becomes the service's real seat belt.
Comments (0)
Related articles

One cent off and the books won't close: why floating point can't count money, the integer-cents rule, rounding exactly once at the boundary, discounts, taxes, splitting and multi-currency traps, plus seven test cases to run before launch.

Slower with use and fixed by a restart usually means a memory leak: locate it with the three-snapshot method, fix it by its hiding place, verify with the same steps, and leave a memory budget behind.

A 2 GB upload failing at 99% should not mean starting over: chunk design, slicing and concurrency, server merge, instant upload, three layers of failure handling, and a pre-launch checklist.