After Launch Is When the War Starts: A Retention and Win-Back Playbook for Vibe Projects
Launch day is the peak; what follows is the war. This hands-on guide covers defining D1/D7/D30 without fooling yourself, reading cohort tables, segmenting churned users into 4 tiers and 6 churn reasons, a channel selection matrix, 3 copy-paste win-back email templates, tiering SQL, PostHog/Plausible setup notes, a Resend vs self-hosted SMTP comparison, 5 anti-patterns, and a day-30/60/90 review checklist.
On launch day you stared at the realtime traffic curve for three hours and posted a screenshot to your friends. Then the curve fell off a cliff on day two, and by day three the comments section was silent. You called that a failure, but it's the normal opening act for every vibe project: launch isn't the finish line, it's the first time you get real user data. This guide is about what comes after launch — how to read retention data, how to know who's churning, and how to win them back. I've stepped in all of these holes myself, and used these exact methods to more than double D30 retention on a few projects.
Section 1: Define Your Retention Metrics Before You Read Them
Most indie developers watch two numbers first: signups and DAU. They share one trait: both can make you feel good, and neither tells you what to do next. Signups include the curious, the misclicks, and the people who forgot they registered. DAU going up might mean you posted on X; going down might mean it's the weekend — after reading them you still don't know what to change.
The golden trio is D1 / D7 / D30, but only if each is defined precisely. D1 retention = the share of day-one active users who came back the next day. Note the denominator is "day-one active users," not "registered users." Use registered users and the number looks artificially low, and you'll misdiagnose the product as unwanted. Also note that PostHog's default retention chart counts "came back on day N," which can differ from your own calculation by 5+ points. Define it once, write it down, and the whole team (that's you) uses the same definition forever.
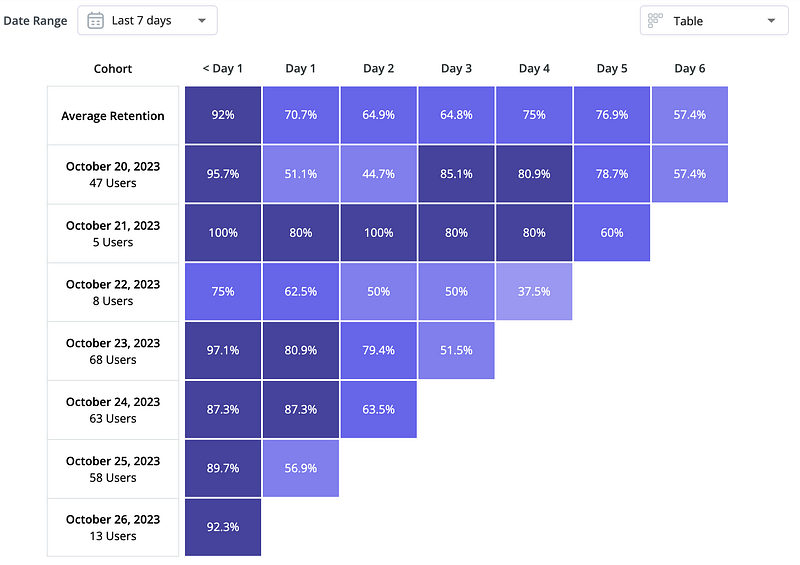
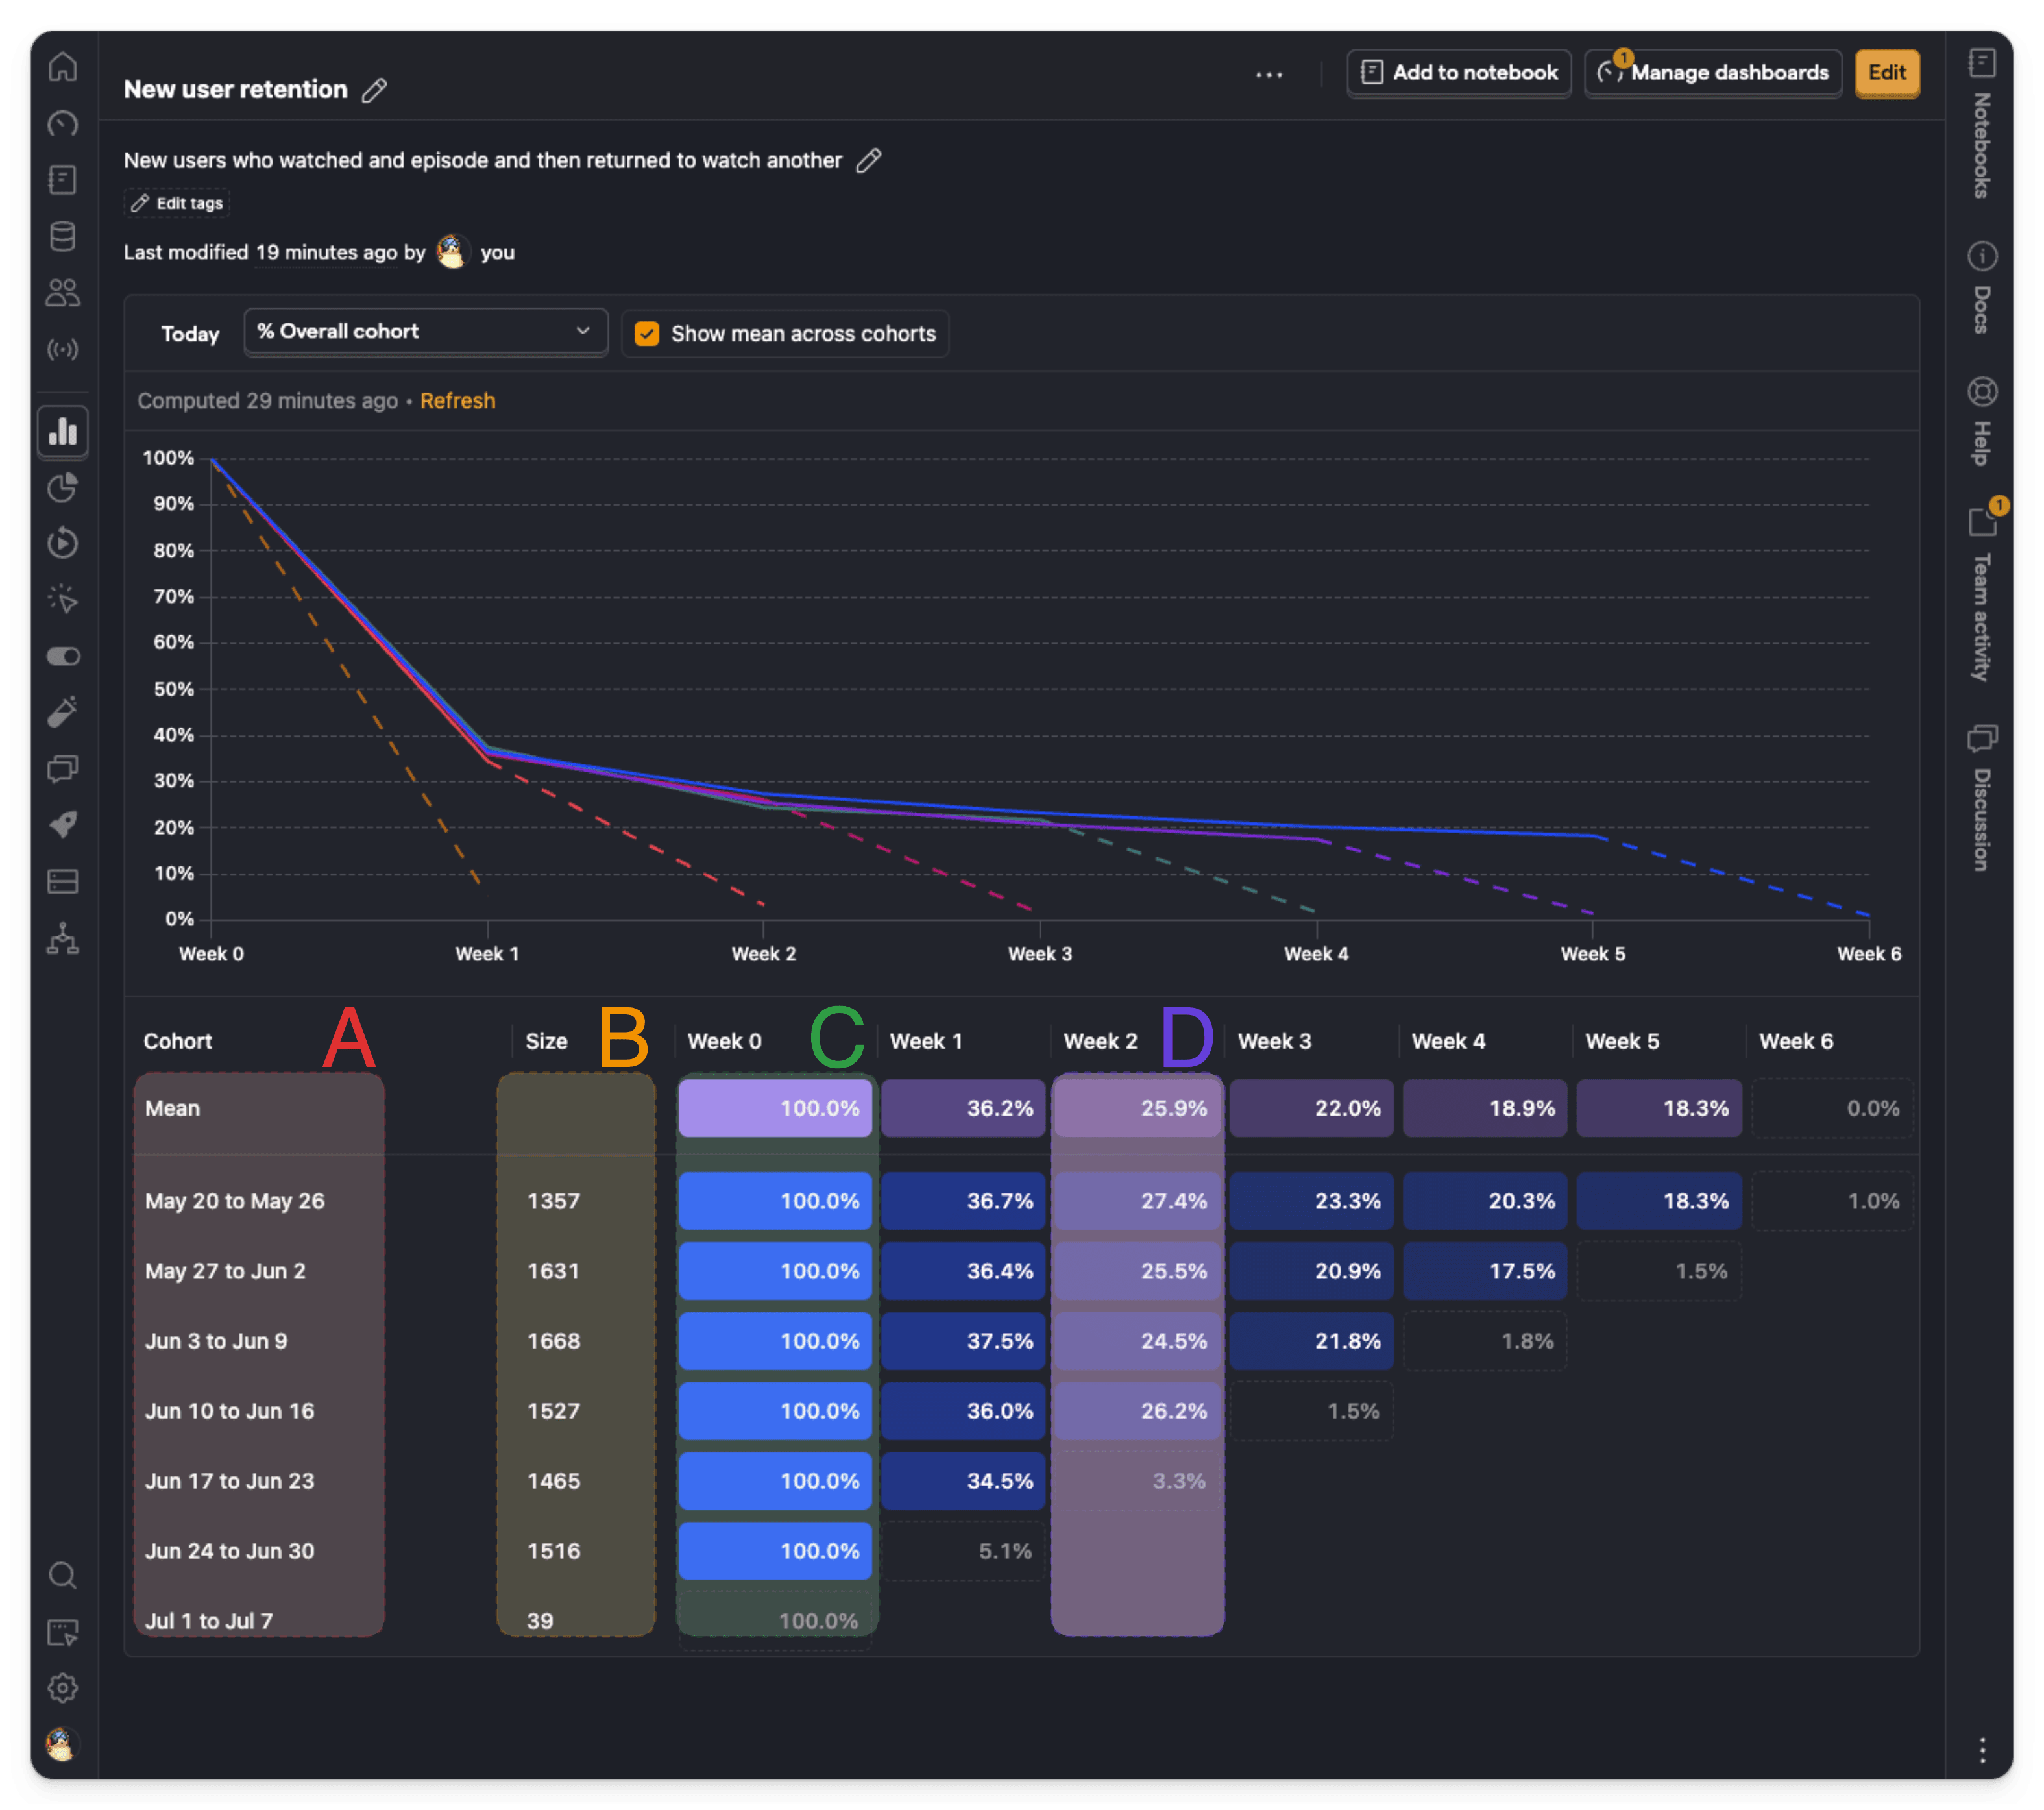
Reading a cohort retention table is simple: rows are signup weeks (or days), columns are day 1, 7, 30, cells are retention rates. Look at three things. First, compare down a single column: is the last two weeks' D7 better than last month's — that's your evidence that a change worked. Second, look at the decay curve within a row: how much drops between day 1 and day 7. A product that loses 80% between day 1 and 7 has a totally different disease than one that loses 40%: the former means "users didn't get what the product is for," the latter means "they got it, but didn't think it was worth it." Third, never look at the average. Split cohorts by acquisition channel — Product Hunt traffic and Google search traffic can differ by 2x in retention, and blending them tells you nothing.
Activation and retention in one sentence: retention is a lagging indicator of activation. Whether a user completes your defined "aha moment" within 24 hours of signup basically decides whether they're still around on day 30. My approach is to work backwards: find the biggest behavioral difference between retained and churned users, and define that as the activation event. For an AI writing tool, say 90% of retained users generated 3+ pieces of content on day one — then "3 generations on day one" is the activation event. After that, every growth action — onboarding, emails, push — exists to push users to that event. Don't define five activation events. One is enough.
Vanity metrics trap list — tape it next to your monitor:
- Total registered users: a number that only goes up. Reading it is pointless.
- Page views / PV: includes crawlers and your own debugging traffic.
- Email subscribers: a different thing from product usage. Don't mix them.
- Social media followers: followers don't pay and don't renew.
- Single-day DAU peak: everyone looks good on Hacker News front-page day. What matters is the decay slope after the peak.
Only three numbers deserve a daily look: D7 retention (latest cohort), activation rate (share of new users completing the activation event within 24 hours), and paid conversion rate. Everything else is monthly-report material.
Section 2: Segment Churned Users Before Discussing Why They Left
"Churned users" is too coarse a label. A user gone 3 days and a user gone 90 days need completely different win-back strategies. My segmentation is simple — four tiers by last active time:
| Tier | Definition | Status | Win-back approach |
|---|---|---|---|
| Active | Activity within 7 days | Healthy | Don't disturb; normal product updates only |
| Slipping | 8–30 days inactive | Churning now | Highest win-back ROI tier — handle first |
| Churned | 31–90 days inactive | Churned | Needs a strong reason (new feature / discount / survey) to return |
| Dormant | 90+ days inactive | Basically gone | Touch once per major release only; don't waste budget |
Why does the 8–30 day tier have the highest ROI? Because they still remember you. Past 30 days, the user's memory of the product starts fading — they'll stare at your email subject wondering "who is this." Past 90 days, it's basically re-acquisition. So win-back budget and energy always go to the "slipping" tier first.
After segmentation comes attribution: why did they leave. I bucket churn reasons into 6 types, each needing different win-back tactics:
- Price: tried it, didn't think it was worth it. Signals: visited pricing page, low trial-to-paid conversion. Tactic: don't just discount — "recalculate the math" for them. Show how much time your product saves, or push a cheaper tier.
- Hard to start: signed up, got stuck at step one. Signals: activation event never completed, high help-doc visits. Tactic: don't send feature updates — send a "3-minute getting started" video or one-click templates.
- Missing feature: you lack their core need. Signals: they asked for a specific feature in feedback or email. Tactic: the day that feature ships is the best day to win them back — a 1:1 email works best.
- Switched to competitor: a rival poached them. Signals: churn timing coincides with a competitor launch or price cut. Tactic: don't attack the competitor — stress your differentiator, ideally the one with the lowest switching cost for them.
- One-time need: job done, they left. Signals: heavy day-one usage, then a cliff. Tactic: accept reality — this segment has the lowest win-back rate. All you can do is be remembered next time they need it; content marketing beats win-back email here.
- Technical issues: chased away by a bug. Signals: error logs or support tickets before churning. Tactic: apologize and compensate the moment the bug is fixed — this is the highest-converting segment, because they wanted to use your product.
How do you know which bucket a user is in? Three moves: look at behavioral data (the signals above), send one survey email (template in Section 3), and read your support history. Don't guess — a guessed attribution is worse than none. You'll send discounts to "hard to start" users and tutorials to "missing feature" users, wasting both.
Section 3: The Win-back Playbook — Channels, Cadence, 3 Templates
Win-back isn't "blast one email." It's matching channel and content to tier and churn reason. Start with the channel selection matrix:
| Channel | Fits which churn types | Cost | Open-rate benchmark | Notes |
|---|---|---|---|---|
| Hard to start, missing feature, switched, price | ~$0.0008/email (Resend bulk) | 25–35% | The win-back workhorse; must include unsubscribe link | |
| Push notifications | One-time need, fixed technical issues | Free (self-built) | 5–15% | Requires prior opt-in; copy over 40 chars barely gets read |
| In-app message / banner | Slipping tier (occasional returners) | Free | Reach depends on return visits | Notify only, no marketing; only seen if they come back |
| SMS | High-value paid churn | $0.02–0.05/message | 90%+ | Use once in a lifetime, and only with explicit consent |
Open-rate benchmarks are rules of thumb, not promises: 25–35% is the normal range for win-back emails (higher than regular marketing mail), push is 5–15% depending on whether you secured the permission, SMS opens high but is expensive and intrusive — reserve it for churned users paying $50+/month.
Suggested cadence: for the slipping tier, email #1 on day 10 of silence, #2 on day 20, #3 on day 30, then stop. Three emails with no return means stop — keep going and you'll earn unsubscribes and a "spammy" reputation. The churned tier (31–90 days) gets touched once, only on big events: you shipped the feature they wanted, a major redesign, or a year-end sale.
Below are 3 copy-paste-ready templates. Each includes subject-line guidance — the subject decides 80% of opens, the body decides the rest.
Template A: Feature-update (for "missing feature" churn)
Subject: You asked, we shipped: [feature name] is live
Body:
Hi [name],
Remember you asked for [feature name] on [date]? It shipped today.
What it does in one line: [one sentence, with a GIF or screenshot].
Your account and data are still here — try it now: [link]
If there's anything else you want, just reply to this email. I read every one.
— [your name], indie developer of [product]
Key points: name the specific feature and date they asked — it proves this isn't a blast. Sign as "indie developer," not "the team" — reply rates jump when users feel they're talking to a real person.
Template B: Discount (for "price" churn — use once only)
Subject: 50% off for the next 48 hours — no strings
Body:
Hi [name],
Straight to it: [product] Pro is half price for the next 48 hours: [link]
No "raise then discount" tricks — was [X], now [Y]. It reverts automatically; it won't silently renew at full price to trap you.
If price was why you left, I hope this brings you back for another try. If it was something else, reply and tell me — I want the truth.
— [your name]
Key points: discounts go to "price" churners only, never as a blast (more on this anti-pattern in Section 5). 48 hours creates urgency. The last line — "I want the truth" — is a hook that fishes out real churn reasons.
Template C: Survey (for unknown churn reasons — doubles as attribution)
Subject: Quick question (30 seconds)
Body:
Hi [name],
Noticed you haven't used [product] in a while. No sales pitch — just one question:
What made you stop using it?
One click is enough:
1. Too expensive → [link]
2. Couldn't figure it out / too complex → [link]
3. Missing a feature I need → [link]
4. Switched to another tool → [link]
5. Done with my task, don't need it for now → [link]
Each link carries a parameter — clicking records the answer, no form to fill. As thanks, I'll personally send [a small perk, e.g. 1 free month] to everyone who replies.
— [your name]
Key points: one-click options instead of a form get ~5x the response rate. Links carry ?reason=price-style parameters — a click is attribution. Sending the perk manually (not automatically) forces you to read every reply.
Section 4: Code and Config — Turn Win-back Into a Pipeline
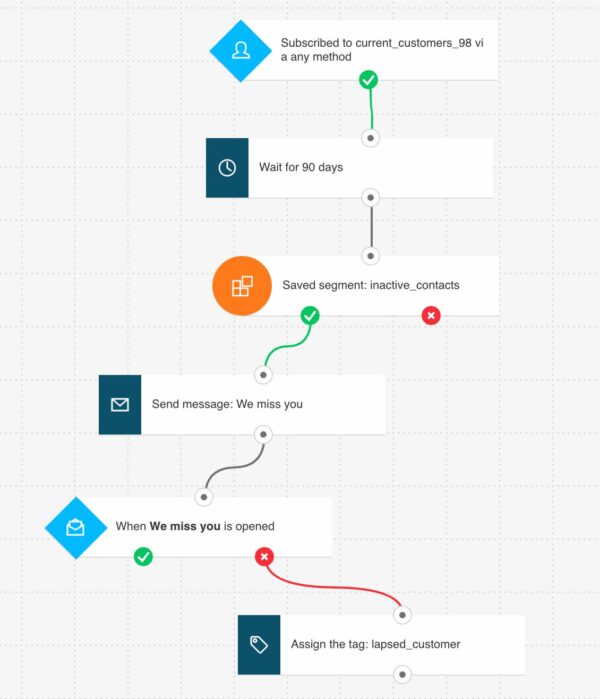
Manually sending win-back emails breaks past ~200 users. At any real scale, win-back has to be an automated pipeline: a cron job segments users → matches templates by churn reason → sends → writes send records for attribution. Here's the code and config for each link.
1. Churn-tiering SQL (Postgres, runs daily, writes into a churn_tiers table):
-- Runs daily at dawn: tags users by last-active time
INSERT INTO churn_tiers (user_id, tier, computed_at)
SELECT
  u.id,
  CASE
    WHEN MAX(e.created_at) > NOW() - INTERVAL '7 days'  THEN 'active'
    WHEN MAX(e.created_at) > NOW() - INTERVAL '30 days' THEN 'slipping'
    WHEN MAX(e.created_at) > NOW() - INTERVAL '90 days' THEN 'churned'
    ELSE 'dormant'
  END AS tier,
  NOW()
FROM users u
LEFT JOIN events e ON e.user_id = u.id
WHERE u.created_at < NOW() - INTERVAL '7 days'   -- exclude users registered < 7 days ago
  AND u.email IS NOT NULL
GROUP BY u.id
ON CONFLICT (user_id) DO UPDATE
  SET tier = EXCLUDED.tier, computed_at = EXCLUDED.computed_at;
Two details matter: the events table should only record meaningful behavior (logins don't count — core feature usage does), or your tiers get polluted by refreshed sessions. And users registered less than 7 days are excluded — new users have their own onboarding flow; don't mix it with win-back.
Plus an attribution query — after the win-back emails go out, who came back:
-- Win-back attribution: users active within 7 days of send count as won back
SELECT
  s.template,                       -- which template was used
  COUNT(*) AS sent,
  COUNT(*) FILTER (WHERE e.user_id IS NOT NULL) AS winback,
  ROUND(100.0 * COUNT(*) FILTER (WHERE e.user_id IS NOT NULL) / COUNT(*), 1) AS winback_rate_pct
FROM winback_sends s
LEFT JOIN events e
  ON e.user_id = s.user_id
 AND e.created_at BETWEEN s.sent_at AND s.sent_at + INTERVAL '7 days'
WHERE s.sent_at > NOW() - INTERVAL '30 days'
GROUP BY s.template;
Every win-back email must log a row in winback_sends (user_id, template, sent_at). Without that table you'll never know which template worked, and win-back stays superstition.
2. Cohort setup notes for PostHog / Plausible
PostHog: go to Product analytics → Retention and create a retention chart. Three settings matter: first, set the retention criterion to your activation event (e.g. "generated content"), not the default "pageview," or the numbers inflate. Second, use the same event as both target and criterion — you're measuring "users who did the core action, are they still doing it on day N." Third, add a filter to split cohorts by acquisition channel (utm_source) and compare. Save the insight to a dashboard and have it emailed to you every Monday morning — the free plan supports that.
Plausible: it has no retention chart, so don't force it. Use Funnels for a "signup → completed activation event" funnel and watch the conversion rate; approximate retention trends with Goals plus time-period comparison. Plausible is fine as a lightweight privacy-friendly counter when you're small and events are simple. Once you start tiered win-back, migrate to PostHog sooner rather than later — its cohorts and feature flags are one system, so win-back experiments can be rolled out per cohort directly.
3. Sending channel: Resend vs self-hosted SMTP
| Resend | Self-hosted SMTP (Postfix / Postal) | |
|---|---|---|
| Cost | Free 3,000/month, then ~$0.0008/email | Server cost, near zero |
| Deliverability | High — they maintain IP reputation | On you; new IPs landing in spam is the norm |
| Setup cost | 10 minutes, call the API | Half a day minimum, plus SPF / DKIM / DMARC |
| Unsubscribe / complaint handling | Built in | You build it |
| For whom | 99% of indie developers | 100k+ emails/month with someone to maintain it |
The verdict is direct: use Resend. The money you save on self-hosted SMTP won't cover one afternoon debugging why you landed in spam. Always send from your own domain (hello@yourdomain.com) — bulk-sending from a gmail address is suicide.
4. Win-back sender script sketch (Python + Resend, weekly cron):
import os, resend, psycopg2

resend.api_key = os.environ["RESEND_API_KEY"]

# 1. Find this week's targets: slipping tier + never received this template
rows = query("""
  SELECT u.id, u.email, u.name, c.tier
  FROM churn_tiers c JOIN users u ON u.id = c.user_id
  LEFT JOIN winback_sends s
    ON s.user_id = u.id AND s.template = 'slipping_v1'
  WHERE c.tier = 'slipping' AND s.user_id IS NULL
  LIMIT 200
""")

for r in rows:
    # 2. Send
    resend.Emails.send({
        "from": "Your Name <hello@yourdomain.com>",
        "to": r.email,
        "subject": "Remember [product]? There's an update you might like",
        "html": render("slipping_v1.html", name=r.name),
    })
    # 3. Log the send — attribution depends on this one line
    query("INSERT INTO winback_sends (user_id, template) VALUES (%s, 'slipping_v1')", r.id)
Three hard rules baked into the script: one user gets at most 1 win-back email per 30 days (dedupe via winback_sends); cap each run with LIMIT — never blast the whole list at once; unsubscribed users go in an unsubscribed table and are excluded from queries. Compliance isn't optional — CAN-SPAM and GDPR fines run higher than your MRR.
Section 5: Five Anti-patterns — Don't Touch These
Anti-pattern 1: Harassment-style win-back. Three "we miss you" emails in a week — users don't miss you, they want to unsubscribe. The ceiling: 3 emails in 30 days for the slipping tier, 1 email on big events for the churned tier. Past that frequency, win-back rates don't rise — complaint rates do.
Anti-pattern 2: Discounts for everyone. Discounts are the most expensive weapon in win-back because they train users to "wait for the sale." Send them to "price" churners only, at most once a year. Send half-price to a "hard to start" user and he'll come back, still not know how to use it, and leave again in 30 days — and you're down 50% of revenue.
Anti-pattern 3: Blasting "we updated!" to everyone. A "v2.0 is here!" push gets under 2% open rates. Users don't care that you updated; they care what it means for them. Push copy must carry a "for you" message: "The export feature you got stuck on now works in one click."
Anti-pattern 4: Win-back without attribution. You sent 500 emails, 30 people came back, and you have no idea which template did it — so next time it's the same stew. Tag every email with its template, log every send in winback_sends, run the attribution SQL weekly (the one in Section 4). Win-back you can't attribute is win-back you shouldn't do.
Anti-pattern 5: Treating win-back as the growth engine. This is the most expensive misunderstanding. Win-back's ceiling is "shave a few points off churn" — it can't fix a leaky bucket. If D1 retention is 10%, the highest-leverage work isn't win-back, it's going back to fix the activation flow. Win-back is a tourniquet, not stem cells. A healthy split: 70% of effort on product and activation, 30% on win-back.
Section 6: The Day 30 / 60 / 90 Review
On day 30, 60, and 90 after launch, spend one hour on these 5 numbers:
- D30 retention (by cohort): the latest cohort's 30-day retention vs. the launch cohort. Up or down — one glance tells you if the product is getting better or worse.
- Activation rate: share of new users completing the activation event within 24 hours. Below 30% means onboarding or product comprehension has a big problem — fix this first.
- Win-back rate: share returning within 7 days of a win-back send, broken down by template. Kill any template below 5% without hesitation.
- Churn-reason distribution: from Template C's one-click data, watch how the 6 reason shares shift. If "hard to start" is climbing, your recent features made the product complicated.
- Win-back cost vs acquisition cost: cost to win back one user (email + discount costs) vs CAC. If win-back costs more than a third of CAC, the strategy is losing money — either too many discounts or you're touching the dormant tier you shouldn't.
After reading the numbers, take 3 actions:
- Kill the worst template: the one with the lowest win-back rate in your attribution data — rewrite or retire it. Fewer, sharper templates win; 3 is enough.
- Fix one break in the activation chain: look at the activation funnel, find the step with the biggest drop, fix that step. Usually it's "the first screen after signup, users don't know where to click."
- Send 1:1 emails to "missing feature" churners: pick 10 users who asked for a specific feature and email them personally when it ships. Bulk win-back is efficiency; 1:1 is reputation — those 10 emails often drive more referrals than 1,000 blasts.
One honest closing note: there is no silver bullet for retention and win-back. I've seen products with 40% D30 retention and products whose win-back rate never cracked 3% after half a year of effort — the difference was never technique, it was whether the product was worth coming back to. Win-back can bring back users who found it worthwhile but forgot; it can't help users for whom it was never worthwhile. Make the product worth returning to first — then win-back matters. The SQL, templates, and matrices in this guide are ready to use. Just don't expect them to answer the hardest question for you: why should users stay?
Related articles
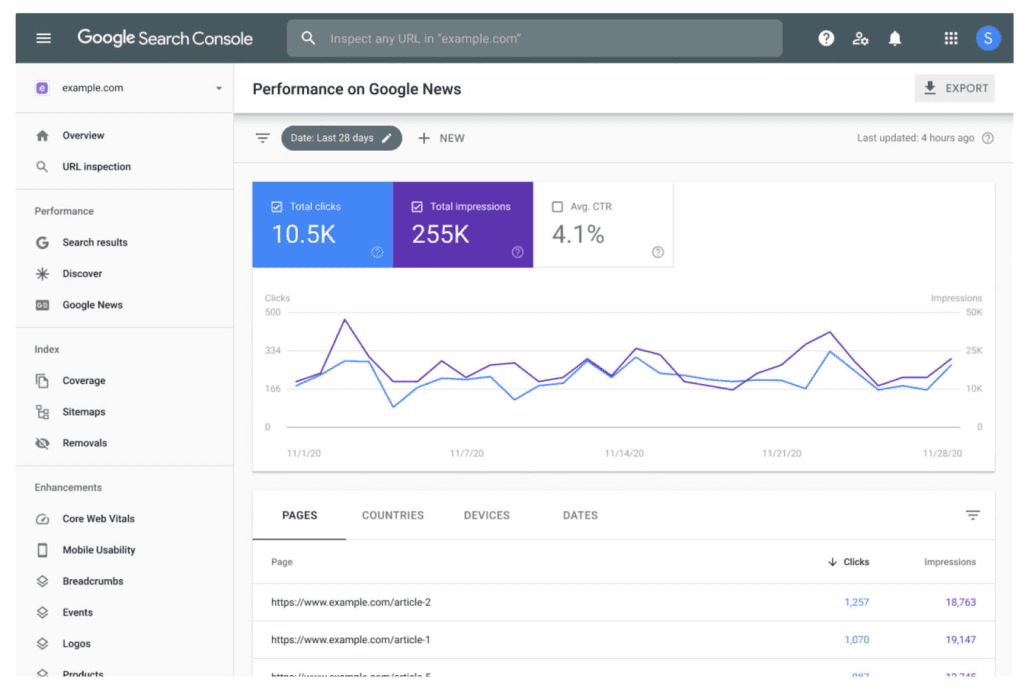
Your vibe-coded site is live — now nobody can find it. This guide gives you the full organic-traffic playbook: a 30-item technical SEO checklist in three tiers, copy-paste Next.js metadata and sitemap code, dynamic OG image generation, safe programmatic SEO without triggering Google penalties, three content growth plays (docs-as-marketing, public changelogs, tutorial topic formulas) with a 4-week calendar, the 4 Search Console reports worth watching, and 5 anti-patterns.

Most vibe projects don't die from being bad — they die from nobody knowing they launched. This combat manual covers the 14-point pre-launch checklist, a 24-hour T-day timeline with five action nodes, copy templates for Product Hunt / Show HN / X / Xiaohongshu, the warm-up arsenal (waitlist, build in public, KOL test list), comment-section combat scripts, a three-level traffic plan with Vercel/Cloudflare setups, and the five funnel numbers that decide whether to keep going.

Vibe projects rarely die from missing features — they die in the first minute after signup. This field guide argues onboarding's job isn't to teach the product but to deliver the promised value fast: a Value Promise Canvas to find your Aha moment, a decision table for three onboarding patterns, 7 signup fields to cut, empty-state copy templates, a paste-ready 3-step React tour component on localStorage, 4 funnel metrics with event naming, and a 10-item pre-launch audit.