Your Site Went White-Screen and a Friend Told You First: Error Monitoring and Crash Reporting for Vibe Projects
Every vibe project has the same darkly comic moment: your site goes white-screen and a friend tells you before your monitoring does. This guide builds a one-person-team error monitoring system: a 5-minute Sentry loop, error boundaries, report context design, backend structured logging, AI-call-specific protection, alert tiers, and a launch checklist.
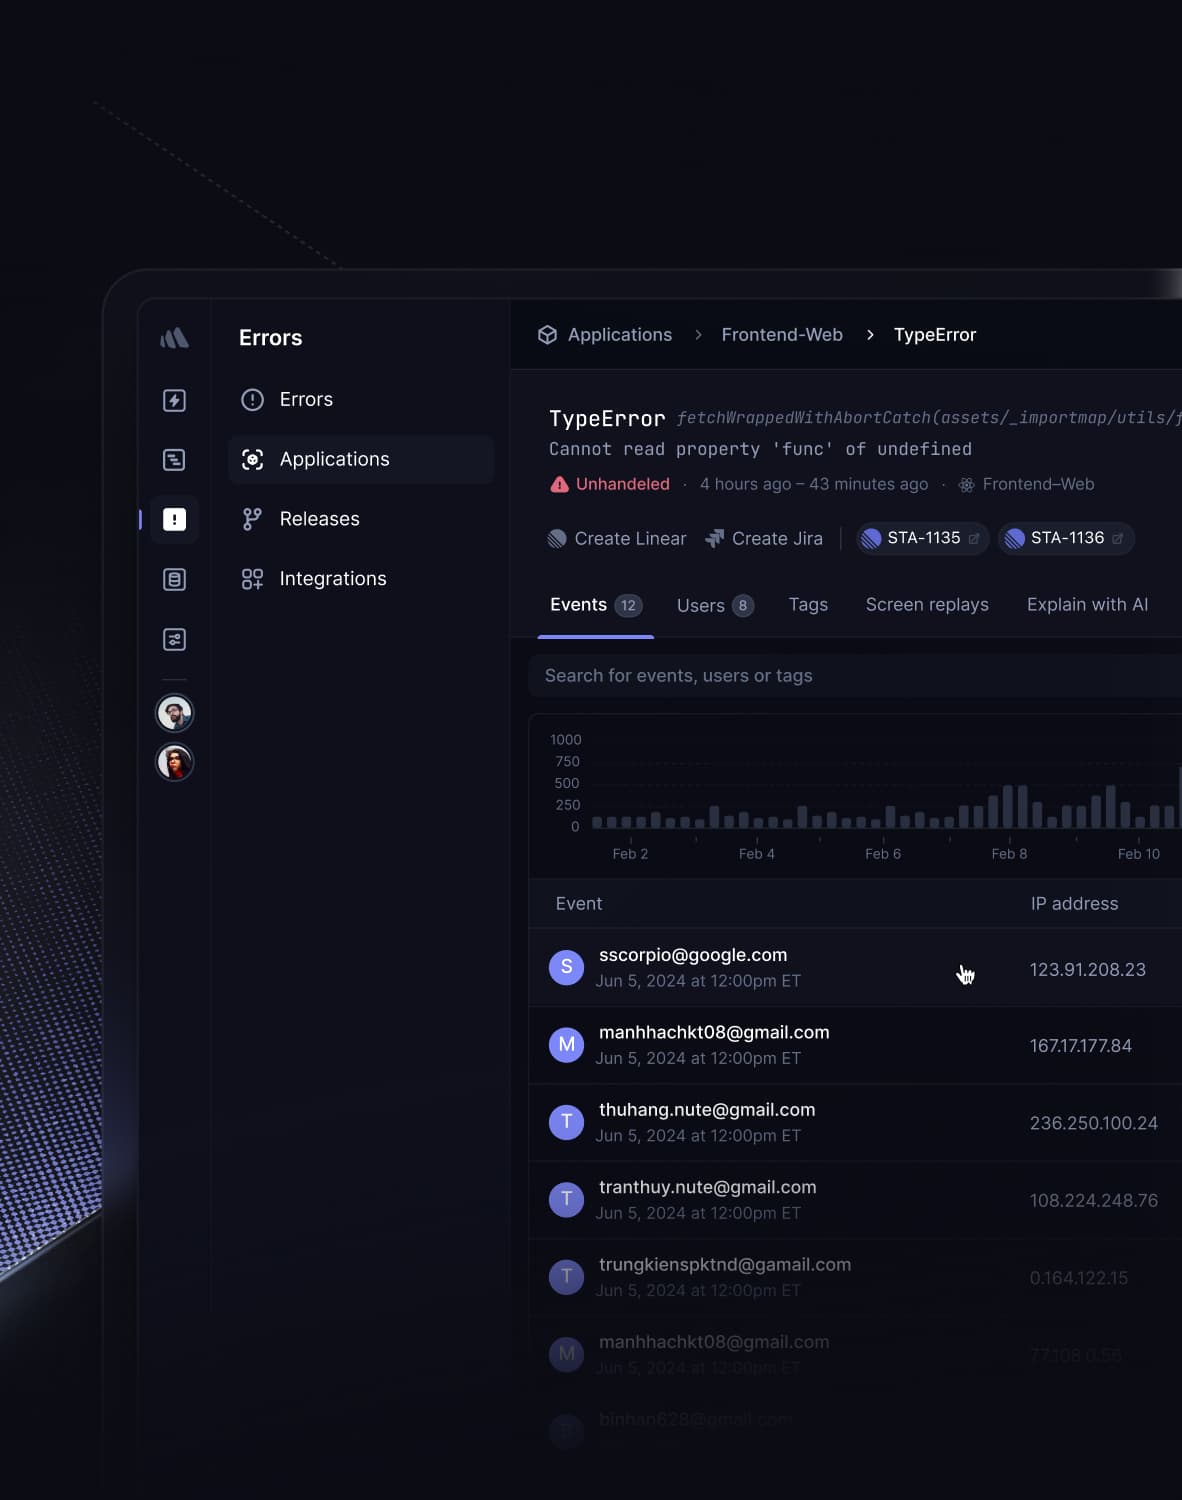
Every vibe project lives through the same darkly comic moment: you proudly drop your link into a group chat, and half an hour later a friend DMs you — "your site is a blank white page." You open it. It really is blank. And you, the author, the person on earth who cares most about this website, are the last to know.
AI built you login, payments, and list pages in 10 minutes, but it never volunteered one fact: it installed zero error monitoring by default. The red errors in your console exist only in your own browser. When a production user hits a crash, they just quietly close the tab — you don't even know how many people hit it, let alone which line broke.
Error monitoring is the line between a vibe project as a "toy" and as a "product." It produces no user-visible feature, yet it decides whether you sleep soundly. This guide gives you an error-monitoring system a one-person team can actually ship — from a 5-minute minimal loop, to report design, alert tiers, AI-call-specific protection, and a launch checklist at the end.
Start with the mental model: monitoring is three layers, not an SDK install
Many people think error monitoring = installing Sentry. A complete pipeline has three layers, and missing any one breaks the chain:
1. Capture: when an error happens, is there code to catch it? On the frontend that's error boundaries plus global listeners; on the backend, uncaught-exception handlers. Without this layer, errors vanish without ever getting reported.
2. Report: send the error somewhere you can actually look at it, with enough context (which release, which user, which step). Reporting isn't "throw the stack trace over the wall" — a stack trace with no context is just an unreadable list of addresses.
3. Respond: after errors arrive, who looks, how fast, and what counts as severe. Monitoring with no response mechanism is a smoke detector installed in an empty house — it can ring all it wants.
One more key distinction: error monitoring ≠ logging. Logs answer "what is the system doing"; error monitoring answers "where is it broken and how many people are affected." Logs are for developers digging during an investigation; error monitoring pushes problems into your face. A vibe project can have crude logs, but it cannot skip error monitoring — because the former means you go find problems, while the latter means problems come find you.
Step one: a 5-minute minimal loop — make errors visible first
Don't design the perfect system on day one. Spend 5 minutes getting the minimal loop working: error happens → auto-reported → you get notified. Add sophistication later.
The lowest-effort option for vibe projects is Sentry (free tier: 5,000 error events/month — plenty for personal projects). For a Next.js project it's one command:
npx @sentry/wizard@latest -i nextjsThe wizard generates sentry.client.config.ts, sentry.server.config.ts, and sentry.edge.config.ts — covering browser, server, and Edge Runtime respectively. Check that it enabled source map upload: without source maps, your stack traces read app-3f2a1c.js:1:23456 — minified line numbers that tell you nothing. The wizard configures this by default, but AI-generated older projects often miss it; manually confirm next.config.ts is wrapped with withSentryConfig.
Three settings to get right before launch:
1. DSN goes in environment variables, never hardcoded. AI-generated code loves hardcoding the DSN into config files. A DSN isn't a high-risk secret (it's the ingestion endpoint, not a read key), but hardcoding becomes a trap when you switch projects or environments. Put SENTRY_DSN in env vars and use separate Sentry projects per environment.
2. Tag release and environment. Ship every deploy with the git commit SHA as the release, and distinguish production from staging. Without tags, you get an error and have no idea whether it fired in production or during your local debugging — errors triggered by vibe coders running dev mode locally polluting production data is the most common false alarm.
3. Start sampling at 1.0, lower it after things stabilize. tracesSampleRate samples performance transactions; error events themselves are unaffected and reported in full. Many tutorials tell you to set 0.1 upfront — that's for saving money at a million DAU. Your project should see real error volume first.
Frontend: error boundaries are the baseline, global listeners are the safety net
In React/Next.js projects, AI's favorite mistake is: one component throws, the whole page goes white. What the user sees isn't "a card failed to load" but the entire app gone. The fix is error boundaries — a decade-old React recommendation that AI-generated code routinely omits.
In a Next.js App Router project, drop an error.tsx into each key route segment:
// app/dashboard/error.tsx
'use client';
export default function Error({ error, reset }: {
  error: Error & { digest?: string };
  reset: () => void;
}) {
  return (
    <div>
      <h2>This section ran into a problem</h2>
      <p>We've logged the issue and are on it.</p>
      <button onClick={reset}>Try again</button>
    </div>
  );
}
Note that 'use client' is mandatory — error boundaries can only be client components. Placement matters: place them by "failure domain" — one under dashboard, one under settings — not a single root error.tsx for the whole site. One site-wide boundary means no isolation: the sidebar crashes, the entire admin goes white.
Error boundaries catch render errors, not these: errors inside async callbacks, event handlers, or failed resource loads. So add two global safety nets at the app entry:
window.addEventListener('error', (e) => {
  // Failed resource loads (image/script 404s) land here with empty e.error
  reportError({ type: 'resource', target: (e.target as HTMLElement)?.tagName, src: (e.target as HTMLImageElement)?.src });
});
window.addEventListener('unhandledrejection', (e) => {
  // Uncaught promises: the disaster zone of AI-generated async code
  reportError({ type: 'unhandledrejection', reason: String(e.reason) });
});
unhandledrejection deserves emphasis: nine out of ten AI-generated async/await snippets forget catch. Nobody writes try/catch, nobody checks, promises fail silently — the user clicks a button, nothing happens, no error on screen. This "silently broken" state is scarier than a white screen, because even monitoring can't see it (unless you have this listener).
What to report: a stack trace without context is no report at all
Once the minimal loop works, the next problem is report quality. Getting 100 TypeError: Cannot read properties of undefined events with no idea what the user was doing, which version, or how to reproduce — that's "placebo monitoring."
Every error report should carry at least these four pieces of context:
1. Breadcrumbs: what the user did before the error. Sentry auto-records clicks, navigation, and console output, but key actions in AI flows need manual instrumentation: "user clicked generate," "3rd retry." Call Sentry.addBreadcrumb at key points. Reproducing a bug doesn't need a stack trace — it needs "the user clicked A, typed B, then it crashed." That's what breadcrumbs are for.
2. User identity: a scrubbed ID, never an email. Sentry.setUser({ id: userId }) is enough. Never stuff emails, phone numbers, or real names into reports — error monitoring platforms are third-party SaaS, and your users' data ends up on someone else's servers. The classic vibe-project trap: AI-generated setUser({ email, name, ...wholeUserObject }) sends the entire user object (tokens included). Grep every reporting call before launch and confirm there's no PII.
3. Version and environment: release + environment. Covered above, no need to repeat. One addition: when error volume spikes after a deploy, the first instinct should be "roll back," not "fix the bug" — and you can only make that call if reports can be grouped and compared by release.
4. Business tags: label which part of the business broke. For example Sentry.setTag('feature', 'checkout'). Among 100 errors, the 1 in the payment flow matters more than the 99 on the marketing page — without business tags you can only sort by count and will forever fix unimportant bugs.
One counterintuitive tip: proactively report "business exceptions," not just code exceptions. "User failed payment 3 times in a row" or "AI generation timed out 5 times" aren't JS errors and won't be auto-captured, but they matter more to you. Use Sentry.captureMessage('payment_failed_3x', 'warning') to instrument them. The vibe-coder fallacy is monitoring only "did the program crash" and never "is the business broken."
Backend: structured logs + traceId everywhere + never die quietly
Frontend monitoring gets done; backends often run naked. AI-generated Node/Python backends handle errors at roughly this level: console.log(err), or nothing at all. When production breaks, you SSH in, tail the logs, and find a lone Error: Request failed — which user, which request, which step, all unknown.
The backend error-monitoring trio:
1. Structured logs in JSON. Stop console.log('user login failed', err); write logger.error({ event: 'login_failed', userId, reason: err.message }) instead. Plain-text logs can only be human-grepped during incidents; JSON logs filter by field directly. pino (Node) or structlog (Python) both start with zero config.
2. A traceId that travels from gateway to database. Generate a unique ID per incoming request, propagate it through every downstream call (including LLM API calls), and attach it to every log line. A user reports "my payment just failed" — you search the traceId and the frontend click, backend validation, payment gateway callback, and database write all line up. Microservice logs without a traceId are a pile of sand — even when your "microservices" are just a separated frontend and backend.
3. Uncaught exceptions must never kill the process silently. Every Node service needs:
process.on('uncaughtException', (err) => {
  logger.fatal({ err }, 'uncaught exception, shutting down');
  // Report first, then exit — don't keep serving in an unknown state
  setTimeout(() => process.exit(1), 1000).unref();
});
process.on('unhandledRejection', (reason) => {
  logger.fatal({ reason }, 'unhandled rejection, shutting down');
  setTimeout(() => process.exit(1), 1000).unref();
});
The key point: report, then exit, and let the process manager (PM2/Docker/K8s) restart a clean process. The nightmare is "the exception got swallowed and the process keeps serving in a half-initialized state" — a half-dead service produces intermittent errors, the most painful kind to debug. Pair this with a health check (/healthz) so the orchestrator automatically pulls bad instances.
AI-call specifics: the failure surface unique to vibe projects
Generic error-monitoring guides end here, but vibe projects have a unique failure surface: the LLM call itself. Unlike a database — which errors loudly when down — LLM failures are "soft": timeouts, truncation, hallucinations, exhausted quotas. Each needs dedicated handling.
1. Timeouts are mandatory, and layered. Set 60–120s timeouts on LLM API calls (for streaming: 15s first-token timeout + total timeout). AI-generated code routinely sets no timeout — one upstream model hiccup and all your request threads hang, dragging the whole service down. More subtle: the frontend fetch needs a timeout too (AbortController), or users stare at a spinner forever.
2. Retries need backoff and a cap — 3 max. Retry only on 429 (rate limit) and 5xx; never on other 4xx — wrong parameters won't fix themselves in 100 retries. Use exponential backoff with jitter (1s, 2s, 4s ± random) to avoid retry storms knocking over a just-recovered service. Log a warning on every retry so you can see "retry success rate" afterward.
3. Degradation strategy: when the expensive model is down, fall back to a cheaper one. After two timeouts/5xx from your flagship model, automatically degrade to a cheaper tier and keep serving, tagging logs with model_fallback: true. A user getting a "slightly weaker but working" answer beats a timeout spinner. Degradation is a product decision, not a technical detail: decide upfront which scenarios allow it (chat continuation: yes; code generation: no).
4. Budget circuit breaker: cap spending on AI calls. The classic vibe-project horror story: a bug causes infinite retry loops against the LLM API and burns hundreds of dollars overnight. Enforce daily/per-user spending caps at the gateway layer — exceed it and requests get rejected with an alert. OpenAI/Anthropic dashboards have budget alerts, but those notify after the fact — a hard breaker at the gateway is the before-the-fact protection.
Alerting: tier it, de-noise it, or you'll turn it off
The most common reason error-monitoring projects die isn't that they were never installed — it's that alerts fired too often and got manually disabled. For a one-person team, alerting strategy comes down to two words: tiering and de-noising.
Three tiers are enough:
P0 (look now): payment failure rate spiking, login fully down, 5xx above threshold. Trigger conditions should be strict: e.g., only alert when "same error > 50 times in 5 minutes" — single errors never page you. P0 goes to phone/SMS (PagerDuty free tier, or Sentry's phone alerts directly) — never email alone. Email is a P1 channel.
P1 (look today): a page's error rate > 1%, AI generation failure rate spiking. Email + instant message (Slack/Discord webhook); checking once a day at a fixed time is fine.
P2 (look weekly): scattered edge cases, third-party script errors (from ad blockers, browser plugin injections). Spend 20 minutes weekly sweeping through them in bulk; fix what's worth fixing, ignore the noise.
Three de-noising moves:
1. Deduplicate by fingerprint, not by counting. Sentry groups issues by stack fingerprint by default, but AI-generated code often throws inside loops with stacks differing by one line, splitting one bug into 50 issues. Merge issues regularly, or write custom fingerprint rules (group by error.type + module).
2. Write ignore rules first. In week one, add these to ignore: errors injected by browser plugins (chrome-extension://), resource failures from ad blockers, known errors on old browsers (Object.hasOwn missing on Safari 14, etc.). These can't be fixed and shouldn't be yours to fix — keeping them only drowns real signal.
3. Error budgets: cap the "known but unfixed." E.g., "IE-family errors ≤ 20/week; exceed it and it becomes P1." Without a budget mechanism you're stuck in a dilemma: fix everything (impossible) or ignore everything (miss real problems).
Cost and tooling: big results on a small budget
Sentry free tier (5,000 error events + 10k performance transactions/month) covers 99% of vibe projects. Hit the limit? Lower sampling first (tracesSampleRate: 0.1), then filter with beforeSend:
Sentry.init({
  beforeSend(event) {
    // Drop known third-party noise before it costs quota
    if (event.exception?.values?.[0]?.stacktrace?.frames?.some(
      f => f.filename?.includes('chrome-extension'))) return null;
    return event;
  },
});
If data sovereignty/privacy matters, use GlitchTip (open-source, Sentry-API-compatible, self-hostable — a small 2C4G VPS runs it). Near-zero SDK changes: just point the DSN at your instance. The price is operating storage and backups yourself; disk fills up first when error volume grows.
Already using PostHog for product analytics? Turn on its error tracking (Exception Autocapture) and skip an extra SaaS account. The tradeoff is weaker error analysis than Sentry (grouping, source maps, release health all a tier down) — fine for the "better than nothing" stage.
The tooling conclusion is simple: start with Sentry's free tier; switch only when quota or privacy genuinely becomes a problem. In error monitoring, the most expensive thing isn't the SaaS bill — it's the months you spent not installing it because it felt like hassle.
Launch checklist: run through it in the 10 minutes before release
1. Sentry (or alternative) SDKs on all three runtimes: client, server, edge — none missing.
2. Source map upload verified: open a test error in Sentry; the stack shows source line numbers, not minified ones.
3. release = git SHA, environment = production/staging tagged.
4. error.tsx in key route segments (split by failure domain, not one for the whole site).
5. window.onerror + unhandledrejection global safety nets added.
6. setUser carries only a scrubbed ID; grepped every reporting call for PII (emails/phones/tokens) — none found.
7. Business exceptions instrumented proactively (payment failures, AI timeouts), not relying on auto-capture alone.
8. Backend: structured logs + traceId propagation + report-then-exit on uncaughtException.
9. LLM calls: layered timeouts, retries ≤ 3 with backoff, degradation strategy, spending circuit breaker.
10. Alert tiers configured: P0 via phone/SMS with strict thresholds; ignore rules added for browser-plugin noise.
One-line summary: the value of error monitoring isn't "how many errors you collected" — it's "for the worst error, did you know before your users did." Get the minimal loop running in 5 minutes; everything after is gradually reducing noise and raising quality. Your next late night should never again start with a friend's "your site is a white screen."
Related articles
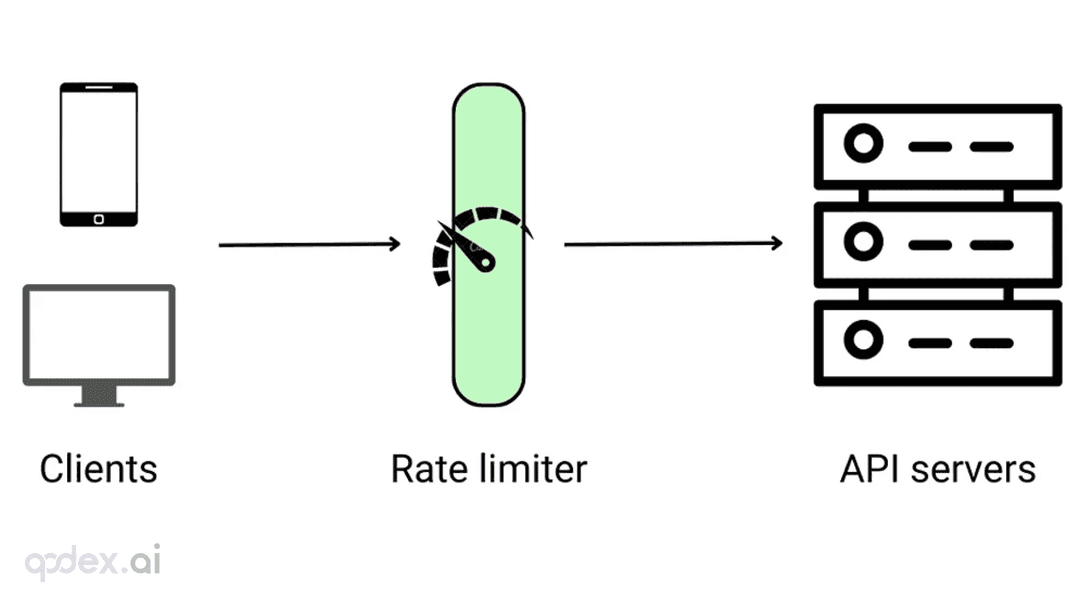
Every public endpoint will be called beyond your expectations some night. This guide builds a one-person-team rate-limiting system: algorithm choice (sliding window vs token bucket), four-layer defense, AI-endpoint money-burning protection, quota design, 429 response conventions, false-positive triage, and a launch checklist.

Every vibe project eventually needs scheduled jobs: daily syncs, expired-order cleanup, billing reconciliation, scheduled reports. AI's first version is usually setInterval — fine for dev, fatal in production. This guide maps four scheduling options, cron expressions and timezone traps, idempotency, distributed locks against overlap, failure retries and alerting, run-log observability, and cron endpoint auth — plus a launch checklist.
Every vibe project hits the same moment: a list page firing a dozen DB queries per load, the database melting under modest traffic. This guide starts from the three-question caching mindset, then layers HTTP cache headers, Next.js data caching, Redis application caching with key design and the penetration/breakdown/avalanche defenses, and AI result caching (semantic cache, prompt caching), plus invalidation strategy and a launch checklist.