Load Test Before You Launch: k6 Load Testing and Capacity Planning for Vibe Teams
AI-written code runs perfectly for one user and can collapse under 100 concurrent ones on launch day. This guide gets your first k6 script running in 15 minutes: derive load scenarios from real user behavior, read p95/p99 and saturation signals, locate DB, connection-pool and third-party API bottlenecks with a three-axe method, convert test numbers into paying-user capacity, and put load testing into CI as an automatic gate.
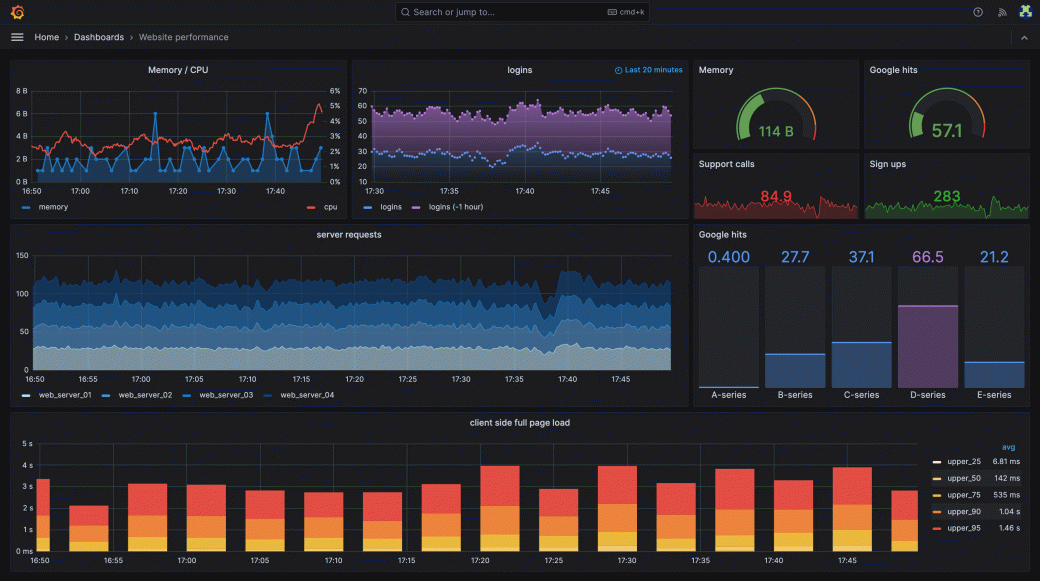
That October story on this site about DHH's Campfire rewrite hitting a 1% delivery rate under load testing should send a chill down every vibe coder's spine: if even DHH's team can blow up in a load test, what makes the rest of us—armed with nothing but "it works on my machine"—think we'll hold up?
One boundary first: our Performance Optimization Playbook covered the techniques for going "from working to fast." This guide covers the methodology for proving, before launch, "how many people it can handle." Optimization writes the prescription; load testing is the checkup—this guide teaches you how to do the checkup.
This guide assumes you already have a working vibe project, a staging environment, and 15 free minutes. No load-testing experience or ops background needed—the k6 script below runs copy-paste, and you'll know how to read the metrics after section 4. The only prerequisite is honesty: when the numbers look bad, don't move the threshold. Fix the code.
Why vibe projects need load testing most: AI code's three concurrency amplifiers
AI-written code has a structural blind spot: it's only ever validated in a single-user world. Runs locally, tests pass, demo is silky smooth—all conclusions drawn at 1 concurrent user. But production problems are never about "does the feature work"; they're about "what happens when 100 people click at once." AI-generated code hides three concurrency amplifiers that stay invisible until traffic arrives, then scale exponentially:
Amplifier one: N+1 queries. AI writes list pages with ORMs in lazy-loading mode almost by default: fetch 50 orders, then one extra user lookup per order. Locally, 51 queries finish in 30ms and it looks fine; at 100 concurrent users that's 5,100 queries per second—database connections saturate and p99 jumps from 100ms to 10 seconds. This isn't "slow," it's "sudden death past a certain concurrency," and AI will never warn you about that implicit loop of queries.
Amplifier two: the missing connection pool. AI rarely configures a connection pool on its own. Serverless functions open a fresh database connection per request and close it after; Postgres defaults to max_connections = 100, so the 101st concurrent request starts queueing and the 200th fails outright. The symptom is deeply misleading: everything is fine at 50 concurrent users, then latency falls off a cliff at 120—you think the code got slow, but connections were just queueing. AI doesn't write connection pools not because it can't, but because "1 concurrent user locally" can never reveal the difference.
Amplifier three: external APIs with no timeout. Your endpoint calls a model API, a payment provider, a maps service—and AI-generated code often sets no timeout. When the other side is slow for 3 seconds, one of your workers is occupied for 3 seconds; under concurrency, the worker pool gets dragged to death by external dependencies. Worse: you're load-testing someone else's SLA while paying per-call AI API bills—a single load test can burn a week's budget.
A one-person team has no QA; load testing is the only objective quality gate before shipping. Don't count on traffic "ramping up slowly" to buy you optimization time: a Product Hunt launch or one viral X post takes traffic from 0 to 100 as a step function. Fifteen minutes of load testing before launch is the cheapest insurance you can buy.
Why is AI-written code especially prone to this? Because the model's training data is overwhelmingly "handle one request" code—tutorials, StackOverflow answers, open-source demos. None of them tell you "here's how this behaves at 200 concurrent users." AI just reproduces the most common pattern it has seen, and "thinking about concurrency" happens to be the kind of knowledge human engineers earn through production incidents, not documentation. Ask AI to write, and you get the optimal solution for a single-user world; concurrency is a dimension that only appears after the fact, and AI's validation loop has no slot for it.
There's also a bad habit unique to vibe teams: demo-driven development. AI scaffolds a complete feature in 10 minutes, you click through it in the browser, "it works," you deploy. Nowhere in that "write code → eyeball it → ship" loop does anyone ask "what about 100 people clicking at once?" Traditional teams at least had testing and code review as two gates; vibe teams outsourced both gates to AI's confidence—and AI's confidence is the cheapest currency there is. Load testing is the gate you add back yourself: objective, unsentimental, results in 15 minutes.
Your first k6 script in 15 minutes
Why k6? Three reasons: a single binary, install-and-go; scripts in JavaScript, zero learning curve for vibe coders; built-in threshold assertions that tell you "pass or fail" instead of dumping charts on you to interpret. JMeter is powerful but heavy, with XML scripts that are painful to version-control; Locust needs its own Python environment plus master/worker setup for distribution. For a first load test, minimize friction—get the first set of numbers in 15 minutes, then talk about advanced.
Three steps. First, install: brew install k6, or docker run --rm -i grafana/k6 run - <script.js. Before running, spend 3 minutes on prep so your first run doesn't measure nothing: staging must be running the latest deploy; the staging database needs realistically-sized data (see section 3); and confirm staging's machine spec matches production—a clean bill of health on 2-core staging says nothing about 2-core production if you tested on 8 cores.
Second, save this as load.js—it runs as-is:
import http from 'k6/http';
import { check, sleep } from 'k6';

export const options = {
  // Ramp: 30s up to 20 virtual users, hold 1 minute, 30s down
  stages: [
    { duration: '30s', target: 20 },
    { duration: '1m', target: 20 },
    { duration: '30s', target: 0 },
  ],
  // Pass bar: p95 latency < 500ms, failure rate < 1% — red otherwise
  thresholds: {
    http_req_duration: ['p(95)<500'],
    http_req_failed: ['rate<0.01'],
  },
};

export default function () {
  const res = http.get(`${__ENV.BASE_URL}/api/health`);
  check(res, {
    'status is 200': (r) => r.status === 200,
    'body is not empty': (r) => r.body.length > 0,
  });
  sleep(1); // simulate user think time — don't remove
}
Third, run it: BASE_URL=https://staging.yourapp.com k6 run load.js. Key points: stages is the ramp—never start at full load; warm up, then measure steady state. thresholds is the exam's passing bar—a load test without thresholds is theater. sleep(1) simulates the pause between real user actions; remove it and you're not modeling users, you're rehearsing a DDoS.
Reading your first summary takes five lines: http_reqs is total requests; under http_req_duration you'll see avg/med/p(90)/p(95)—check p(95) against your threshold directly; http_req_failed is the failure rate; vus_max confirms virtual users actually ramped up; checks shows assertion pass rate. If the thresholds line is red ✗, k6 exits non-zero—which is exactly the mechanism CI uses to block a PR, as section 7 will show.
Organize scripts as a trio, not one file doing everything: smoke.js (10 VUs, 2 minutes, for CI smoke), load.js (expected peak traffic for 10–15 minutes, the pre-launch checkup), spike.js (0 to 500 concurrent in 30 seconds, simulating the launch-day spike). Three files sharing the same scenario functions, each with different thresholds—lenient for smoke, strict for full runs. The classic vibe-team mistake is "one script for everything," which makes CI take 15 minutes, nobody wants to wait, and the load test quietly gets deleted from CI.
Your first run will probably go red. Congratulations—that's the load test saving you money instead of your users discovering it after launch.
One iron rule first: point k6 at staging only, never at the production database. The topology should look like this, with all four observation points:
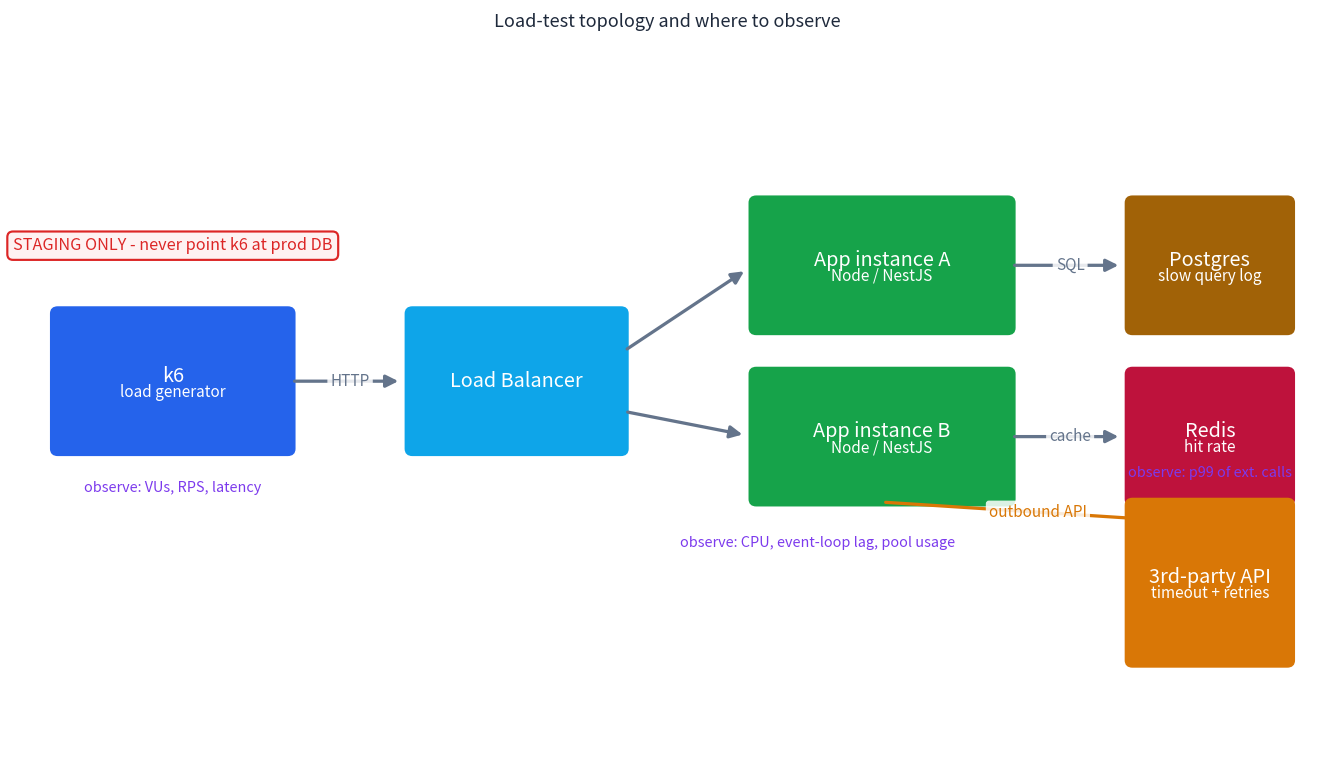 Load-test topology: k6 only ever hits staging. Four observation points—k6 side watches VUs/RPS/latency; app side watches CPU, event-loop lag and pool usage; DB watches the slow-query log; third-party APIs watch p99 and timeouts. Reading k6's numbers without server-side metrics is driving blind.
Designing scenarios: don't load-test the homepage, load-test the money path
The most common rookie posture: spread virtual users evenly across every endpoint, press each one, and produce an all-green report. That's self-deception—real traffic is never uniform. Your homepage might take 70% of traffic while checkout takes 2%, but a broken checkout is the actual P0.
The right approach is to derive the load model from real user behavior, backwards. List your core paths: signup → login → browse the list → place an order. Look at production (or beta) access logs and weight each path by its real share. No production logs yet? Estimate from beta: get 5 friends to use the app for 10 minutes each, then run awk '{print $7}' | sort | uniq -c | sort -rn | head -20 on the gateway access log—top endpoints and their ratios pop right out. Weights don't need decimal precision; "list page 70%, detail 20%, checkout 10%" at the right order of magnitude is enough. A load model is a map, not a satellite photo—right direction beats precision.
k6's scenarios exist for exactly this:
export const options = {
  scenarios: {
    browse: {       // 70% of traffic: browsing the list
      executor: 'ramping-vus',
      exec: 'browseFlow',
      stages: [{ duration: '2m', target: 70 }],
    },
    checkout: {     // 20% of traffic: ordering (writes — must test)
      executor: 'ramping-vus',
      exec: 'checkoutFlow',
      stages: [{ duration: '2m', target: 20 }],
    },
  },
};

export function browseFlow() {
  http.get(`${__ENV.BASE_URL}/api/products`);
  sleep(2);
}

export function checkoutFlow() {
  const login = http.post(`${__ENV.BASE_URL}/api/login`, JSON.stringify({
    email: `loadtest-${__VU}@example.com`, password: 'test1234',
  }));
  const token = login.json('token');
  http.post(`${__ENV.BASE_URL}/api/orders`, JSON.stringify({ sku: 'SKU-001' }),
    { headers: { Authorization: `Bearer ${token}` } });
  sleep(3);
}
Four design judgments, each earned in a pit:
- Test the write path. Reads are cheap, writes are expensive. Pressing only GET endpoints is barely a test—locks, transactions and unique-index conflicts all live on the write path. Staging data must reset with one command; don't let test orders poison the next run.
- Don't share one token across all VUs. A hundred logins on the same account gives you flattering fake numbers from rate limiters and caches. Keep a pool of test accounts, distinguished by
__VU. - Load-test login, not just the homepage. The homepage is often statically cached—pressing it measures your CDN. Login, search and checkout hit the database and business logic; that's your real cost.
- Think time is part of the scenario. Real users click, then read for two seconds. A test without
sleepinflates RPS threefold; every conclusion is wrong, and it looks like you know what you're doing—the most dangerous kind of wrong.
Before designing scenarios, tell the four test types apart—don't use a hammer as a ruler: load testing asks "is it stable at expected traffic" (the mandatory pre-launch exam); stress testing asks "pile it on until something breaks—where's the ceiling"; spike testing asks "0 to 500 concurrent in an instant," simulating the moment you hit the front page, and cures the "ramp was fine, real spike killed us" disease; soak testing holds constant pressure for hours to catch memory and connection leaks. With limited time, remember the priority: load test before every launch, add a spike test when you can, and let CI run the soak on a schedule.
One more seriously underrated input: staging data. Load-testing against 20 rows of AI-generated fixtures reports "excellent performance"—because indexes and full table scans are indistinguishable at 20 rows. Staging data should be production-scale: hundreds of thousands of users, millions of orders. It doesn't need to be real data, but it needs real scale and distribution. Otherwise you're testing a system that doesn't exist, and the conclusion is worse than no test at all—it gives you false confidence.
Reading the metrics: p95, error rate, saturation signals, and "false healthy"
k6 spits out a wall of numbers after a run. Beginners watch two: "Requests/sec" and "Avg." The conclusion first: average latency is the most useless metric in load testing.
p50, p95 and p99 describe a distribution: p95 = 500ms means 95% of requests were faster than 500ms, and 5% were slower. Why p95 over average? Because averages lie: with 95 requests at 100ms and 5 at 8,000ms, the average is 495ms—"looks okay"—but that 5% is often your most engaged, most willing-to-pay users, waiting 8 seconds and then churning. Set thresholds on p95/p99 only, never on the average.
Error rate (http_req_failed) is the second red line. Start with rate<0.01; before launch, push it under rate<0.001. Note: read error rate at the target RPS—0 errors at 20 concurrent users and 5% errors at 200 means the ceiling sits somewhere in between, and your job is to find it.
Where do SLOs (those numbers in your thresholds) come from? Work backwards from user tolerance, not gut feel: p95 500ms for API endpoints, 2 seconds for first screen render, p99 3 seconds for the payment flow—these are the web's common-sense lines. Write them into thresholds; exceeding one is a bug, same severity as "button does nothing." The cardinal sin is "run the test, look at the results, then set the threshold"—that's defining the passing bar from the results: always green, always useless. Set thresholds before testing, and don't quietly loosen them on the night a run goes red; if a threshold is genuinely wrong, change it through a proper process, not by editing numbers at midnight.
Saturation signals look like this: RPS stops climbing as you add virtual users, while the latency curve starts rising exponentially. The intuition is Little's Law: concurrent requests in the system = RPS × average latency. Latency rises, queued requests pile up, latency rises further—that's how avalanches start. The "throughput plateaus + latency takes off" combo is your capacity ceiling; pushing past it just measures what collapse looks like.
For a concrete feel: at 50 VUs you get 180 RPS with p95 300ms; at 100 VUs, RPS is still 185 but p95 has shot to 2.1s—the ceiling is 180 RPS, and the extra 50 users are just queueing. Then look at the server side: if CPU is pegged, it's a compute bottleneck; if CPU is idle but latency still flies, something is queueing—locks, the connection pool, or an external dependency. Where RPS plateaus, combined with where the queueing happens, reveals the bottleneck; the three-axe method in the next section follows exactly this logic.
The sneakiest failure is "false healthy"—all green numbers, nothing actually tested. Three classic forgeries:
- 200 with an empty body. AI code loves swallowing exceptions: a
catchblock returningres.json({})gives you status 200 with empty data. Socheckmust assert on body content, not just status. A weakly-asserted load test is barely a test. - Everything hits the cache. Two minutes of pressing, 99% Redis hit rate, and the origin server asking "who exactly are you testing?" Watch the cache hit-rate metric; either disable the cache to measure the worst case, or warm it to the real hit rate—pick one, don't mix.
- Staging's database is empty. A 100-row table lives entirely in memory; its query plan has nothing in common with production's 10-million-row table. Staging data volume should approximate production—at minimum, make the index-vs-full-scan boundary real.
One-line judgment: if p95 breaches the SLO, don't optimize yet—first confirm the test itself isn't cheating. Optimizing a fake problem costs more than not optimizing.
Quick reference for k6's core metrics, to read against the summary: http_req_duration (latency percentiles—watch p95/p99), http_req_failed (failure rate), http_reqs (total requests; divide by duration for actual RPS), vus/vus_max (virtual users—confirm the ramp really climbed), iteration_duration (single iteration time, including sleep), checks (assertion pass rate), data_received (bandwidth—if RPS won't climb, check whether the NIC filled up first). Custom metrics are easy too: import { Trend } from 'k6/metrics' and record a dedicated Trend for business-critical endpoints like checkout—its p95 is the number your boss should see.
The three-axe method for locating bottlenecks
When the numbers go red, don't panic—bottleneck hunting is a closed loop: test for numbers → locate the bottleneck → change one thing at a time → re-validate with the same script → loop again if it's not green. Get this loop spinning instead of "feels slow, add a server":
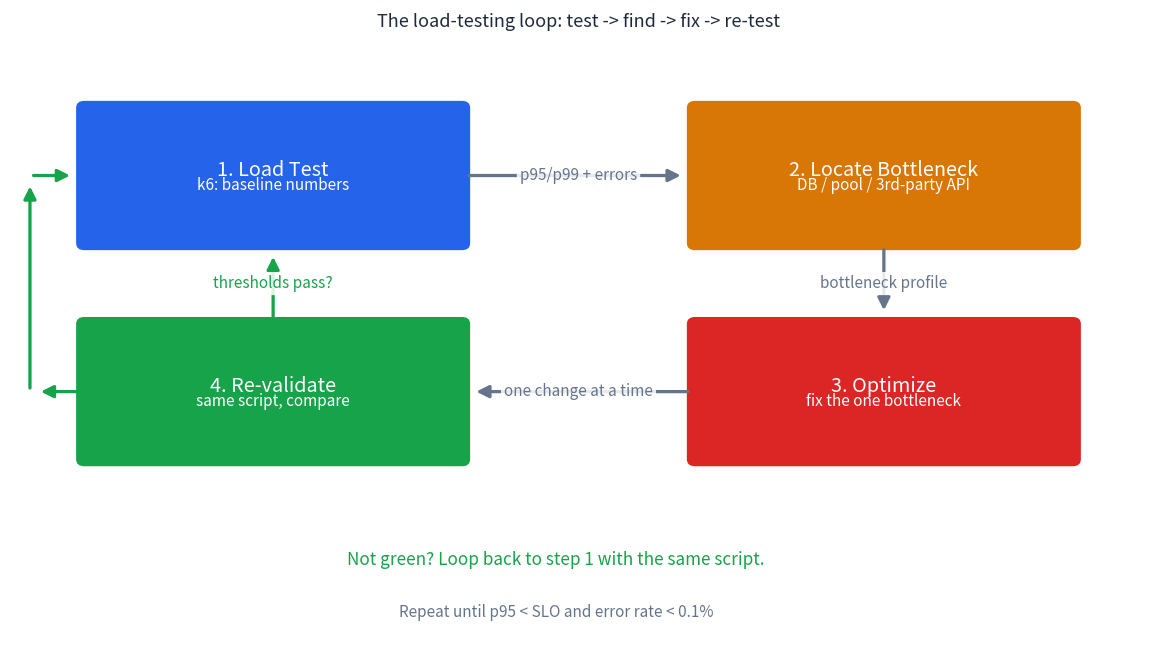 The load-testing loop: the same script is your ruler—measure every regression with it. Change one thing at a time. Change three things at once and when p95 drops you won't know who deserves the credit, leaving you unable to reproduce the fix when it regresses.
Axe one: the database. Start with the slow-query log (on Postgres, enable pg_stat_statements and sort by total time). N+1 has a unmistakable fingerprint: the same SQL appearing dozens of times in one request, differing only in parameters. Two fixes: join preloading, or batched merging with dataloader. Triage order: DB CPU saturated first → optimize SQL first; DB CPU idle but the app is slow → the bottleneck isn't the DB, move on.
When digging, don't look at "slowest single query"—look at "total time = average time × call count": a 5ms query called 20,000 times costs more than an 800ms query run 3 times. Sort pg_stat_statements by total_exec_time; whatever ranks first is usually what you fix. In AI-generated Prisma/Drizzle code, grep for findUnique/findFirst inside loops—nine out of ten N+1s look exactly like that. After fixing, confirm with EXPLAIN ANALYZE that the plan actually uses the index, rather than going from "50 full scans" to "1 full scan."
Axe two: the connection pool. Symptom: latency falls off a cliff past some concurrency level while DB CPU stays low—connections are queueing, not working. Check the pool's wait-queue length on the app side. Fix: configure a pool; a decades-old rule of thumb works fine for a one-person team—connections ≈ CPU cores × 2 + effective disks. For serverless, put PgBouncer or a pooling database proxy in front. The most common AI-generated pattern is new Client() per request—grep your codebase for it first.
Serverless deserves its own warning: functions on Vercel/Netlify may open a new connection per invocation, and serverless Postgres providers like Neon and Supabase all offer pooled connection strings (usually port 6543 via PgBouncer)—AI-generated code uses the direct string nine times out of ten. The fix is swapping one connection string, five minutes of work, but without a load test you only learn this the moment production starts dropping connections. Count actual connections during a test with pg_stat_activity: if the count climbs with concurrency, no pool is doing anything.
Axe three: third-party APIs. Put a timeout on every external call (3s connect, 10s read as a starting point) plus a circuit breaker; mock external dependencies during load tests—otherwise you're load-testing someone else's API, possibly on your bill. The fix kit: timeouts, retries with backoff, degradation (serve stale cache rather than letting the whole chain hang).
The order of the three axes matters too—don't swing blindly: check error rate first—5xx errors mean read the log stack traces, those are explicit bugs; if errors are clean but p99 is ugly, find which segment the slow p99 requests spend time in (DB, external API, or queueing) with distributed tracing or simple span timers; if latency rises uniformly (p50/p95/p99 all up together), some global resource is likely topped out—pool, CPU, bandwidth; if only the tail rises (p50 fine, p99 flying), it's usually lock contention, GC pauses, or one slow dependency. I've seen all four in AI-generated code, and the "uniform vs. tail-only" split cuts your search space in half within five minutes.
An illustrative case: a list endpoint where we fixed the N+1 (50 queries merged into 2) and went from no pool to a pool of 20—measured before and after with the same k6 script:
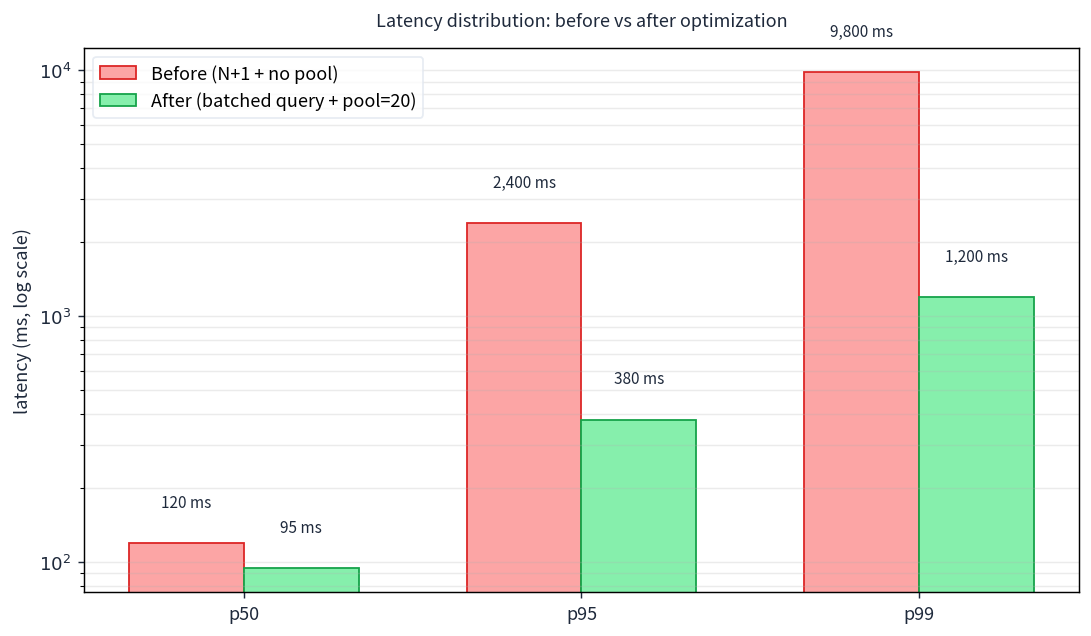 Latency distribution before vs. after optimization (illustrative data): p50 dropped just 25ms, p95 dropped 6×, p99 dropped 8×. Tail latency is where N+1 and connection-pool problems live—watching only the average makes you miss the real wins.
Capacity planning: turning load-test numbers into "how many paying users"
The ultimate question of load testing isn't "what's the p95"—it's "when the boss asks how many users we can handle, can you give a number?" You can, and the formula isn't complicated.
One line:
concurrent users = sustainable RPS ÷ requests per second per user
"Sustainable RPS" is the maximum RPS from your test where p95 stays under SLO and error rate under 0.1%. A full worked example (illustrative numbers, reusable method):
- Test result: at 120 RPS, p95 = 420ms (SLO is 500ms), error rate 0.05% → sustainable RPS = 120.
- User behavior: an active user makes 1 request per 8 seconds → 0.125 rps per user.
- Concurrent users: 120 ÷ 0.125 = 960 simultaneously active users.
- Headroom: always keep 40% spare for deploys, jitter and crawlers → 960 × 0.6 = 576.
- Peak online ratio: SaaS products typically see 15–25% of registered users online at once; take 20% → supports 2,880 registered users.
- Paid conversion: at a 10% paid rate → about 288 paying users.
Combined: paying users ≈ sustainable RPS × 0.6 ÷ per-user rps ÷ peak online ratio × paid rate. Every parameter is an assumption—but assumptions written down can be challenged and corrected, which beats "should handle a few thousand, probably" by an order of magnitude.
Make the output a one-pager pinned to your release checklist: sustainable RPS, the SLO it was measured under, the five assumption values, the paying-user conclusion. After every optimization, hardware bump, or caching change, re-run the test and update the page—capacity planning isn't one-off fortune-telling, it's a 5-minute routine before each release. Numbers go stale; the habit of always knowing your headroom doesn't.
Not enough headroom? Three levers, in cost-effectiveness order:
- Raise RPS (fix bottlenecks). Start with the three axes above. Most vibe projects 3–5× their RPS in the first optimization round—kill the N+1, configure the pool, and 120 RPS becoming 500 RPS is a common story. Fix code before adding hardware.
- Lower requests per user. List endpoints returning 20 items instead of 50, polling replaced with SSE/long-polling, static assets pushed to a CDN. Going from 1 request per 8 seconds to 1 per 12 seconds grows capacity 50% without touching a line of backend code.
- Accept reality (rate-limit). If you can't hold up short-term, queue first: per-user limits at the gateway, 429s with a friendly "try again soon" beyond that. Queueing beats crashing—crashing 500s everyone at once, while limiting makes 5% of users wait 30 extra seconds. Set the limit at 80% of your measured ceiling; that's dignity bought with data.
Capacity planning isn't fortune-telling; the numbers will be wrong, but an order-of-magnitude judgment like "120 RPS supports ~300 paying users" decides whether you should add hardware or optimize first—that's the business value of load testing: turning "I feel" into "I measured."
Load testing in CI: making every release take the exam automatically
The biggest enemy of load testing is "only when someone remembers." CI integration has one core rule: thresholds fail, the build goes red. Two layers:
Smoke layer (every PR): 10 virtual users for 2 minutes, checking only "no regression." The official GitHub Action does it in a few lines of YAML. Don't be greedy on first integration: set just two thresholds—p(95)<800 and rate<0.01, one notch looser than your target SLO. Smoke tests catch regressions, they don't prove compliance: an endpoint at p95 300ms last week jumping to 900ms this week turns CI red and blocks the PR—that alone pays for it. Thresholds too strict mean red PRs every day until everyone starts ignoring CI—start lenient, tighten gradually.
- name: Smoke load test
  uses: grafana/k6-action@v0
  with:
    filename: smoke.js
    flags: --env BASE_URL=${{ secrets.STAGING_URL }}
  # thresholds are defined in smoke.js; a breach fails this step and blocks the merge
Full layer (scheduled + major releases): run a 30-minute soak against staging weekly—soak doesn't measure performance, it hunts memory leaks: hold RPS constant for 30 minutes, and if latency creeps upward while memory only grows, something's leaking. AI-generated global caches and never-cleared timers are the usual suspects.
Two judgments: first, thresholds belong in version control, reviewed alongside code—"p95 < 500ms" is a product requirement, not ops trivia. Second, the staging that smoke tests hit must auto-deploy on every push; otherwise you're testing last week's code and red-or-green means nothing.
Don't leave the numbers in CI logs. k6 can ship metrics to Grafana (k6 run --out prometheus or Grafana Cloud k6), with threshold breaches paging straight to Slack—giving you a performance baseline over time. Three months later that baseline will be more honest than any "feels slower" gut check: one release moved p95 from 300ms to 450ms, obvious on the baseline chart, where without it you'd only learn from user complaints. What a one-person team lacks most is exactly this kind of memory-independent, objective record.
Load-testing anti-patterns: six pits, step in none
- Testing production. "Staging matches prod config, so testing prod is more realistic"—realistic, until one misclick becomes a P0. Keep staging data-scale-close and config-identical, and test staging; production gets only small-traffic observation after canary deploys. Don't mix the two jobs.
- Skipping warmup. JIT compilation, pool connection setup, cold caches—discard the first 1–2 minutes of data. Give k6's stages a dedicated warmup ramp and trim head and tail in analysis. Cold-start numbers aren't performance; they're "just woke up."
- Watching only the average. See section 4. An average of 200ms and "5% of users waiting 8 seconds" can coexist—and the latter decides your reputation.
- The load generator dies first. Your laptop's CPU at 90% means you're measuring your own machine's bottleneck. Watch the k6 process's CPU; past 70%, add generators or go distributed—k6's single-machine ceiling arrives earlier than you'd think. Before declaring a "ceiling," confirm the ceiling isn't on your side.
- Cache distortion. Either disable the cache to measure the worst case, or warm it to the real hit rate. Pick one, don't mix—and definitely don't "accidentally" hit 100% and wave an all-green report. You're its only reader; who are you fooling?
- Changing three things at once. p95 dropped after your optimization, but you don't know who deserves the credit—when it regresses, you can't reproduce the fix, and the work was wasted. The loop diagram's "one change at a time" isn't fussiness; it keeps every regression meaningful: each time it goes green, you know why.
Back to the opening boundary: the Performance Optimization Playbook teaches you to take a project from working to fast; this guide teaches you to prove it can hold up. Optimization writes the prescription, load testing is the lab report—examine first, medicate second, re-check after. Before your next release, spend 15 minutes running the script. It's the cheapest insurance a vibe team can buy: a 3 a.m. launch-day crash will always cost more than one red run on staging.
Comments (0)
Related articles

Deploying to xxx.vercel.app is just squatting. This hands-on guide walks the full chain: buying a domain, DNS resolution, the Cloudflare launch path, HTTPS/HSTS, and the SPF/DKIM/DMARC email trio — because your domain is the only asset you truly own.

AI writes code fast but never writes secure code by default: running locally is not the same as being safe in production. This hands-on playbook fills the web security baseline for your vibe project — CSP headers, CSRF tokens, XSS defense, SQL parameterization, the cookie triple, dependency supply-chain gates, plus a copy-ready 10-item pre-launch acceptance checklist.
Voice demos are easy; shippable voice features are pipeline engineering. This guide covers picking the right of three shapes (STT/TTS/realtime), the 400ms latency budget split across capture→STT→LLM→TTS→playback, Whisper vs streaming STT, the TTS quality/latency/cost triangle, interruption and turn state machines, five browser pitfalls, cost modeling with anti-abuse, and a 10-item launch checklist.