Give Your Vibe Project "Eyes and Ears": Observability in Practice for a One-Person Team
AI-written code fails silently at 3am, token bills explode quietly, and user bug reports you can't reproduce — most vibe projects die from being invisible. This hands-on guide gets you to minimum viable observability in one hour: structured logging, OpenTelemetry tracing, one dashboard, two alerts, plus the four metrics you must instrument and three anti-patterns to avoid.
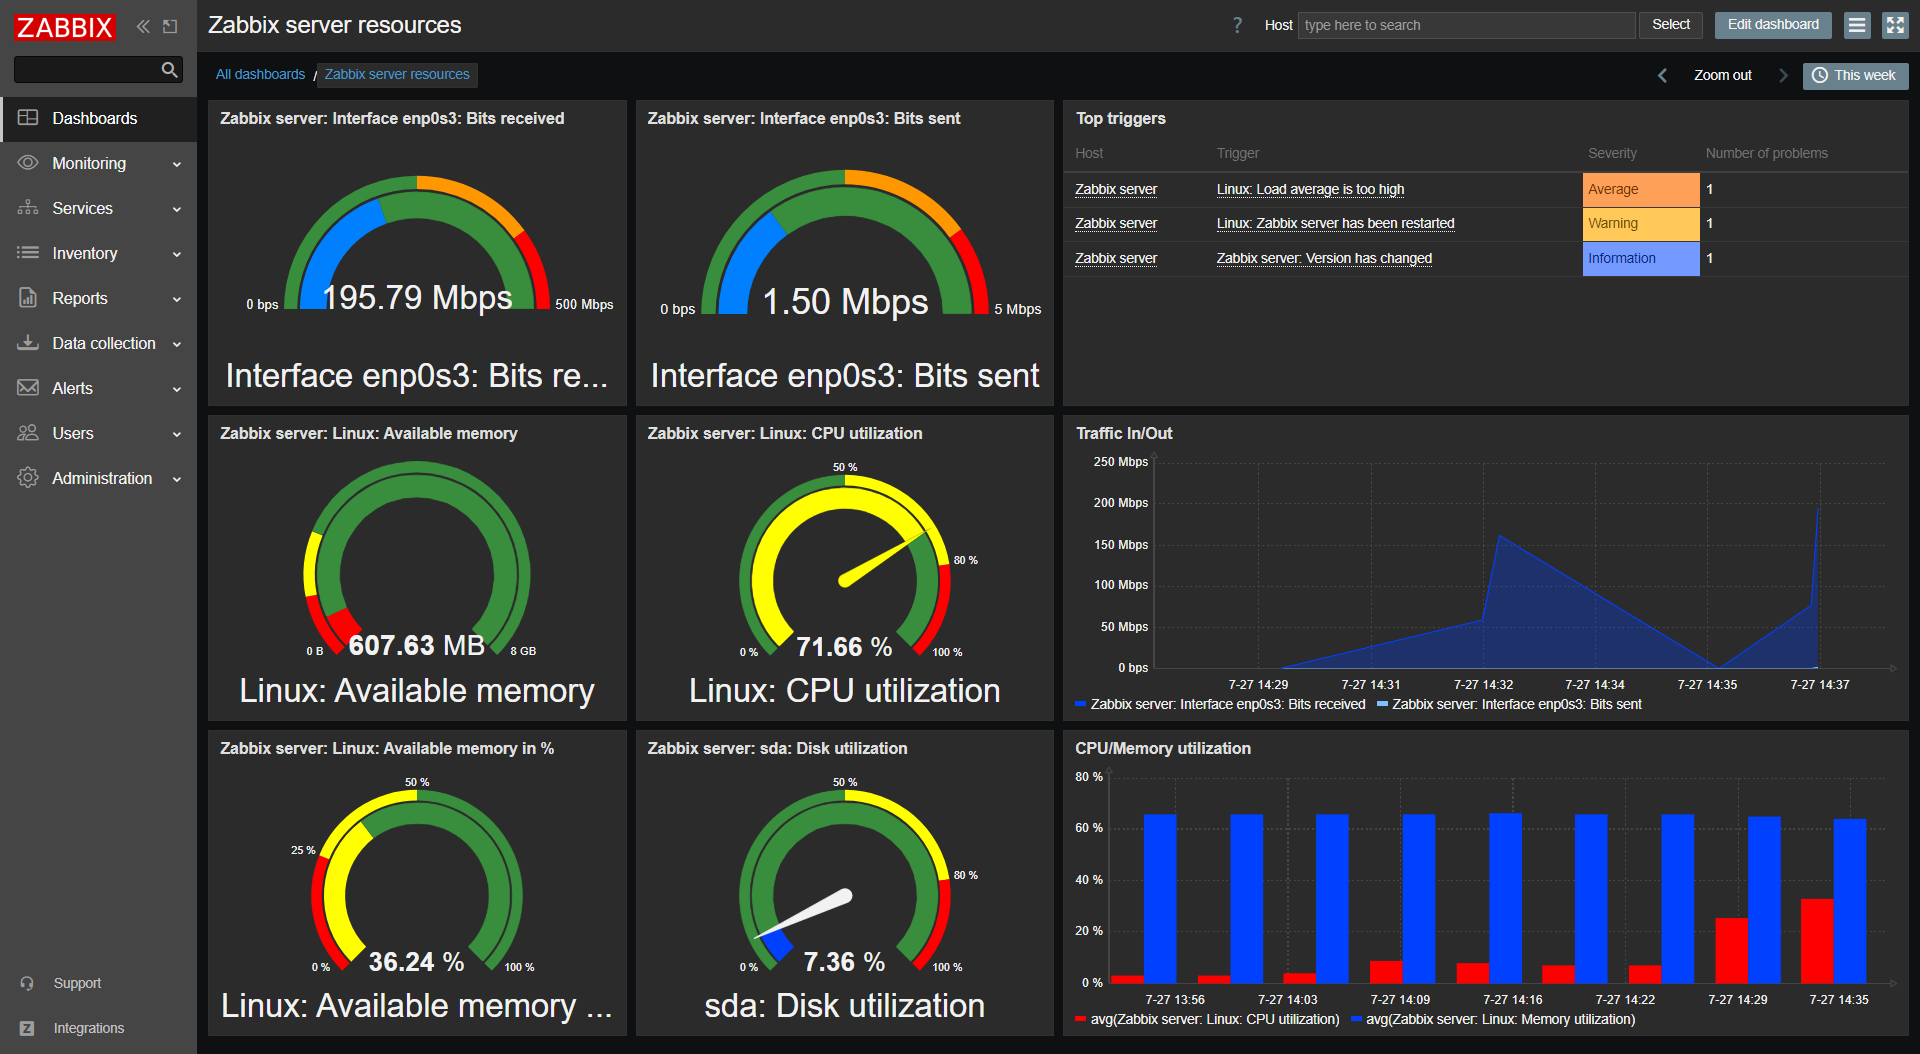
Your project is flying blind — you just don't know it yet
Start with three 3am moments every vibe coder has lived through. One: a user says "checkout just failed," you open the logs, and the screen is full of console.log("here") and console.log(data) — what data actually was, nobody knows, including the AI that wrote that line three months ago. Two: you open the model provider's bill at month's end and token spend is triple last month's, and you have no idea which feature burned it. Three, the scariest: no errors, no complaints, but a cron job has been failing silently for two weeks, and you only noticed when users started churning.
All three share one root cause: your project is flying blind. AI wrote the features for you, but it didn't install the dashboard. Observability sounds like big-company jargon — Datadog, the whole Grafana family — but the one-person-team version takes an hour to set up. This post is the operating manual for that hour.
The conclusion up front: minimum viable observability needs exactly four things — structured logs, distributed tracing, one dashboard, two alerts. Each unpacked below, all written to a "you can do this tonight" standard.
Step one: upgrade logs from sticky notes to spreadsheets
Most vibe projects' logs look like this: AI's casually written console.log("user login", userId) and console.log("error!!!", err), all jumbled together — human-readable, machine-hostile. Debugging means grepping on luck, and anything beyond a trivial production issue leaves you guessing.
The fix is simple and nearly free: emit every log line as JSON. Each line is an object with a fixed timestamp, level, and request ID, plus business fields as needed:
{"ts":"2026-10-07T11:00:00Z","level":"info","req_id":"a3f9…","event":"llm_call","model":"sonnet","tokens_in":1200,"tokens_out":340,"ms":2100}
That single change transforms debugging. Where you used to scan with your eyes, you can now pull a request's full trail by req_id or aggregate per-model call volume and latency by event=llm_call. In Node, pino does it; in Python, structlog — both a few lines of config. When you have AI do the migration, the instruction is crisp: "replace all console.log / print across the project with structured JSON logs, unified fields ts, level, req_id" — exactly the kind of mechanical refactoring AI is best at.
One easily missed detail: the request ID must propagate across the whole chain. Generated on the frontend or at the gateway, one req_id should follow the HTTP request into database queries and into every LLM call. Structured logs without req_id are just tidier sticky notes; with req_id, they become a connectable chain of evidence.
Step two: wire up OpenTelemetry — the first trace waterfall is addictive
Logs answer "what happened"; tracing answers "where did the time go." When your request path becomes "HTTP → auth → vector retrieval → three LLM calls → database write," no amount of log reading reconstructs the latency breakdown — but one trace waterfall shows instantly: ah, 80% of the time is stuck in the second LLM call.
The key choice here is OpenTelemetry, not any vendor's SDK. The reason is practical: OTel is a vendor-neutral standard. Ship traces to self-hosted Parseable today, switch to Grafana Cloud or Datadog tomorrow by changing one exporter line — instrumentation code stays untouched. For a one-person team, "no lock-in" matters far more than "10% more features."
The hands-on path (verified end to end): for a Python project, install opentelemetry-sdk plus the official instrumentation packages for your framework (FastAPI, httpx, SQLAlchemy all have them — pip install plus two lines of init), and ship traces over OTLP. Same on Node: @opentelemetry/sdk-node with auto-instrumentation captures HTTP and database spans out of the box. No ready-made instrumentation for LLM calls? Wrap them yourself: one span around each model call, with model, tokens, and cost as span attributes — that's also your future cost-accounting data source.
For the receiving end, start with Parseable: an open-source observability platform written in Rust, AGPL-licensed, a single ~180MB binary — run ./parseable locally and you get a web UI that ingests OTel traces and logs. Simon Willison did exactly this a few days ago — Datasette 1.0a41 had just added OpenTelemetry support, so he had Codex figure out wiring its traces into a local Parseable and got his trace waterfall. That's how lightweight it is: no Kafka, no YAML marathons.
Managed options work too (Grafana Cloud has a free tier; newer players like Axiom and Highlight are friendly to small volumes). One selection criterion only: it must be running tonight. The biggest risk to an observability system isn't picking wrong — it's "I'll set it up next week" turning into never.
Step three: watch four metrics, set two alerts
Dashboards are where it's easiest to overdo it. I've seen solo projects with 20 dashboard panels that nobody ever opened. Remember: a metric you never read doesn't exist. A one-person team needs four numbers:
- Request latency (p50/p95/p99): the floor of user experience. A quietly climbing p99 is often the earliest signal that a dependency or a model got slower.
- LLM call latency / tokens / cost, broken down by endpoint: the vibe project's signature metric. Which endpoint burns the most tokens must be visible at a glance. Convert cost to money, not token counts — "burned $4.20 yesterday" hurts more than "used 1.8M tokens yesterday," and hurt drives optimization.
- Error rate: split by endpoint and error type. Count "the model responded but the output was unusable" (JSON parse failures, illegal tool-call parameters) as errors too — half of AI-era errors don't look like errors.
- Agent loop step counts: if you run agents (support, coding assistants, workflows), record how many steps each task took. A suddenly stretched step distribution usually means prompt degradation, tool failure, or an agent spinning in place.
Alerts need even more restraint: exactly two. One, error-rate spike (e.g., 5-minute error rate exceeding 3x the trailing hour's average). Two, cost spike (single-day LLM spend crossing a set fraction of your hard budget cap). Everything else can wait. The iron law of alerting: every alert must map to an action you know how to take — otherwise it just trains you to ignore alerts. Cry wolf three times and your phone's notification permission becomes decorative.
One more word on the "hard budget cap": put a code-level circuit breaker on model spend — if daily cost exceeds X dollars, degrade to a cheaper model or reject non-critical requests outright. That's a required course for vibe projects in 2026. Bill explosions never happen gradually; they're always one bad prompt edit or one loop bug burning through cash in a few hours. The breaker is the only thing that hits the brakes for you while you sleep.
The one-hour checklist: do it tonight
Compress everything above into a checklist you can finish tonight. Crack open a soda, start the timer:
- Pick the receiver (10 min): run Parseable locally, or sign up for a managed plan's free tier. One criterion: data flowing in tonight.
- Add the OTel SDK (20 min): install the SDK and framework instrumentation, point the OTLP exporter at your receiver. Let AI write the init code; you verify traces actually arrive.
- Define 3 key metrics (10 min): request latency, LLM cost (split by endpoint), error rate. Don't get greedy — agent step counts can wait until next week.
- Build one dashboard (10 min): a single page with four numbers (three is fine to start). It must answer "is the system healthy right now" at a glance.
- Set two alerts (5 min): error spike, cost spike, delivered somewhere you'll actually see them (phone push, Telegram — not email).
- Break it on purpose (5 min): the most important step. In staging or locally, trigger an error manually and check: does the alert fire, does the dashboard jump, can the trace pinpoint it? An alert that has never fired equals no alert.
Two practical reminders. First, observability itself has a cost: full trace capture will shock you on storage and transfer. Start sampling at 1% — sample 100% of error traces, 1% of healthy ones; that's industry standard. Second, keep sensitive data out of logs: raw user input, API keys, full prompts — redact by default. Future you, handing logs to someone else (or surviving a log-service breach), will be grateful.
Three anti-patterns — count how many you've got
Finally, the three anti-patterns most common in one-person teams. Self-check:
Anti-pattern one: 20 dashboards, never opened. A dashboard's value is in being looked at. If you haven't opened that page in a week, delete it — or shrink it to one line in a phone push. An unwatched dashboard is self-comfort.
Anti-pattern two: too many alerts, now it's "wolf." Alert on 70% disk, alert on a CPU twitch, 30 pings a day — three days later the notifications get muted. Keep only alerts you'd get out of bed for at 3am; demote the rest to dashboard numbers.
Anti-pattern three: logs without metrics. Logs are for locating; metrics are for discovering. Without metrics, your failure-discovery pipeline is permanently "users find it first." Metrics answer "is there a problem," logs answer "where" — the order matters.
Ultimately, observability means something completely different for a one-person team than for a big company. Big companies need compliance and audits; you need peaceful sleep: when something breaks at night, the phone buzz carries information; in the morning, last night's burn is visible at a glance; when a user reports a bug, you reproduce and pinpoint it in ten minutes. AI multiplied your coding speed 10x — the debugging speed to match it has to grow 10x too. Otherwise you're just manufacturing black boxes 10 times faster.
Related articles
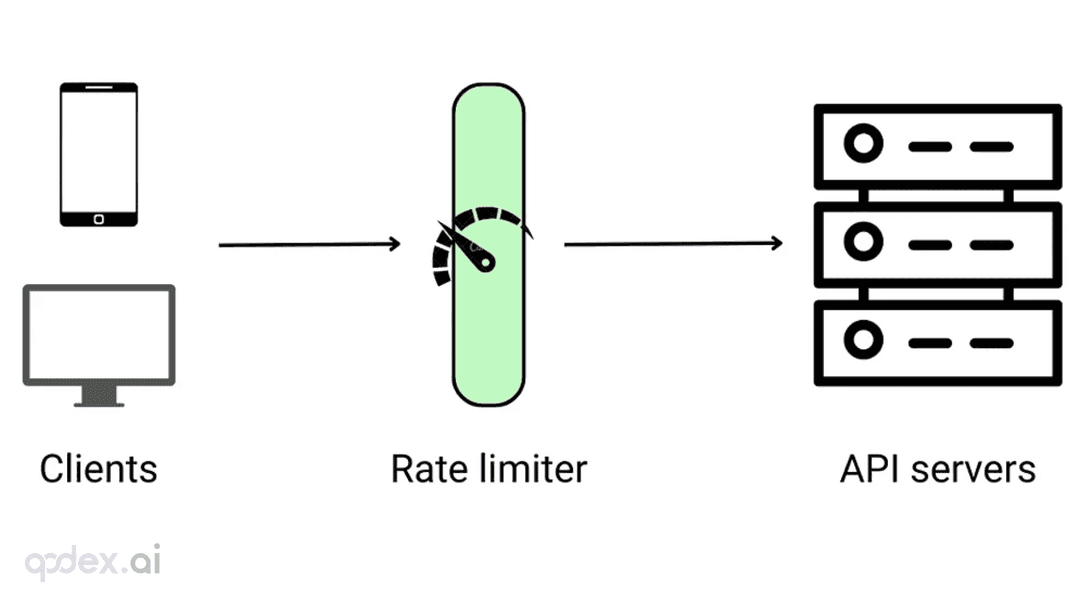
Every public endpoint will be called beyond your expectations some night. This guide builds a one-person-team rate-limiting system: algorithm choice (sliding window vs token bucket), four-layer defense, AI-endpoint money-burning protection, quota design, 429 response conventions, false-positive triage, and a launch checklist.
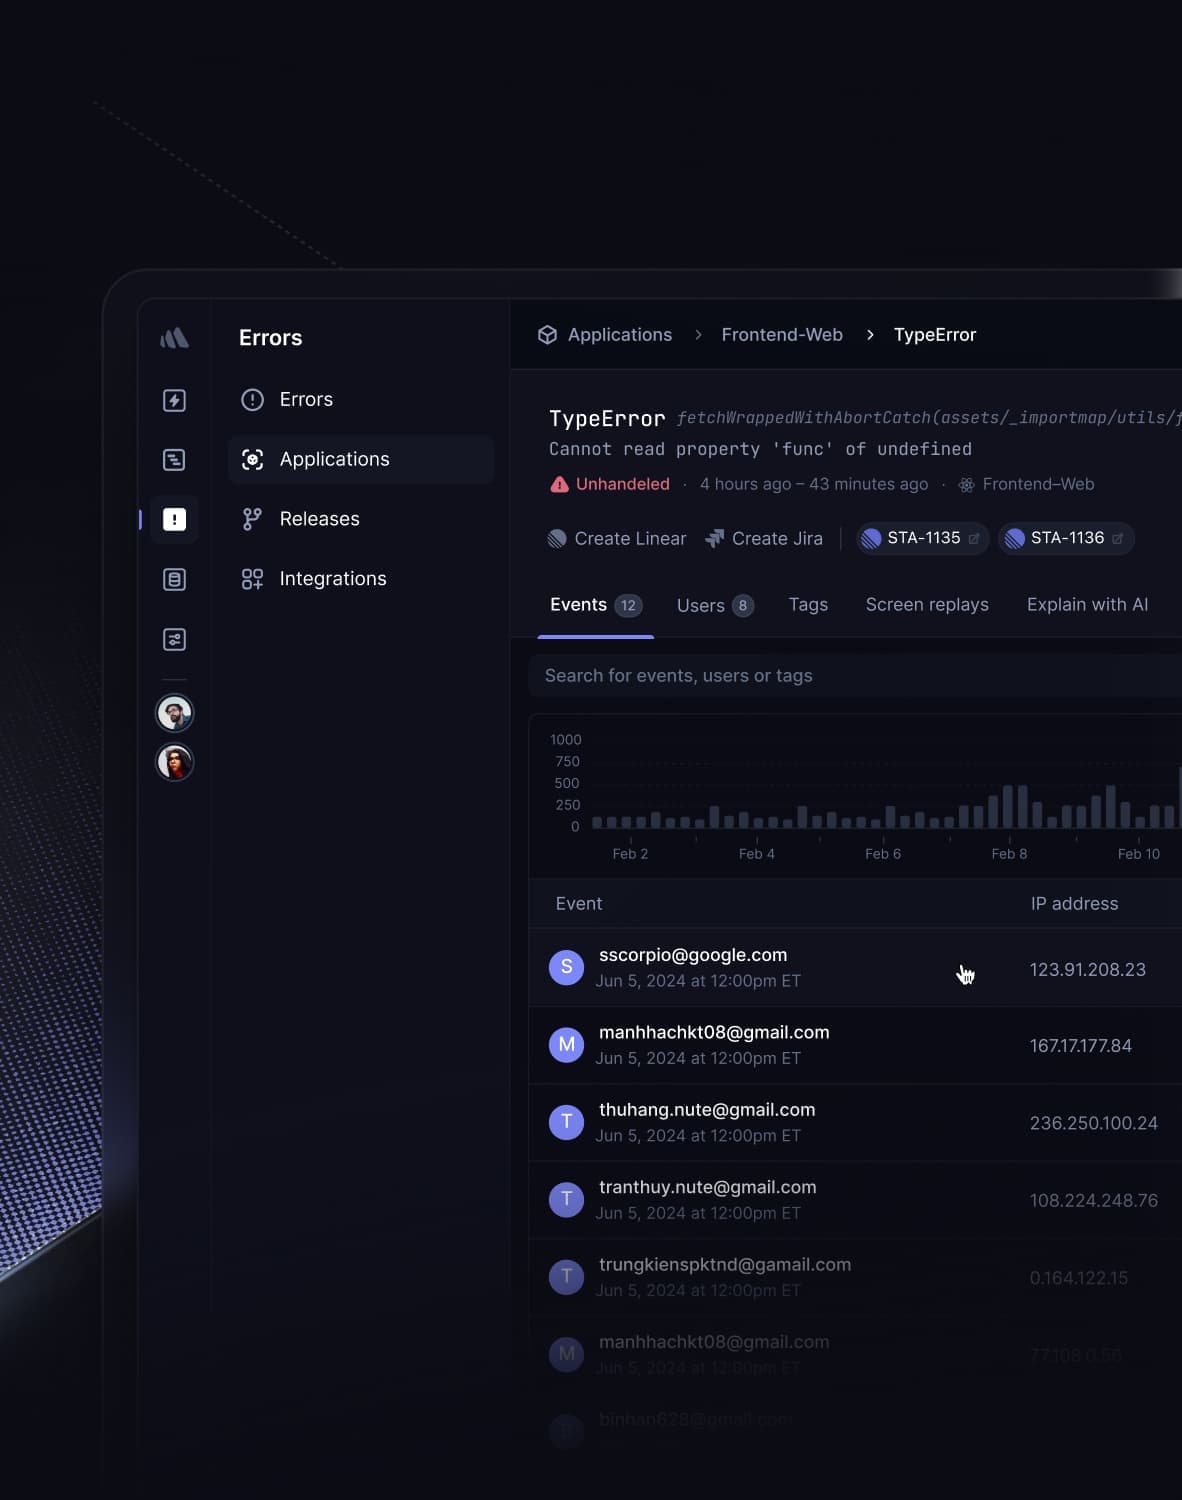
Every vibe project has the same darkly comic moment: your site goes white-screen and a friend tells you before your monitoring does. This guide builds a one-person-team error monitoring system: a 5-minute Sentry loop, error boundaries, report context design, backend structured logging, AI-call-specific protection, alert tiers, and a launch checklist.

Every vibe project eventually needs scheduled jobs: daily syncs, expired-order cleanup, billing reconciliation, scheduled reports. AI's first version is usually setInterval — fine for dev, fatal in production. This guide maps four scheduling options, cron expressions and timezone traps, idempotency, distributed locks against overlap, failure retries and alerting, run-log observability, and cron endpoint auth — plus a launch checklist.