From Works to Fast: Performance Optimization in Practice for Vibe Projects
AI-generated code runs — but it's usually slow: bloated bundles, N+1 queries, raw uncompressed images, zero caching. This is a hands-on performance manual written for vibe coders: from Web Vitals baselines, image and bundle slimming, to data-layer fixes, LLM streaming for perceived performance, and a launch checklist that belongs in CI. Take your project from 'it loads' to 'it flies.'
Check yourself first: the four performance traps in AI-generated code
Coding agents have a fundamental bias: they optimize for "does it run," never for "how fast it runs." Shipping features is their KPI; performance is yours. Almost every vibe project hits these traps after launch — see how many apply to you.
Trap one: dependencies installed without a second thought. You ask for a date picker, the agent installs an entire component library; you ask for an icon, it pulls in a 200KB icon pack. Dozens of "used one function" packages sit in node_modules, and first-screen JS easily blows past 1MB. Agents have no concept of "is this package worth it" — if the import works, it ships.
Trap two: N+1 queries. This is the signature move of AI-generated backend code. The list page fetches 50 records, then loops 50 times to fetch each related row individually. With tiny local dev data it returns in milliseconds and you notice nothing; in production it goes from 200ms to 8 seconds.
Trap three: raw images served as-is. A 4K phone photo becomes the hero image at 8MB a pop; three of them on the homepage is 24MB. On 4G, users stare at a white screen for 10 seconds. Agents won't compress, convert formats, or generate responsive sizes unless you explicitly ask.
Trap four: zero caching awareness. Every request re-queries the database, re-renders, re-computes. Homepage content changes once a day, yet the agent runs the full pipeline on every visit. Caching is the highest-ROI move in performance work — and the one agents least volunteer.
The good news: all four traps have standard fixes, and none require rewriting your project. Below we fill them in order: measure → images → bundle → data → perceived performance → acceptance.
Optimization without a baseline is superstition: measure first
Before touching any code, answer one question: how slow is your site right now, exactly? If you can't answer, don't touch anything. The biggest waste in performance work is optimizing by feel something that was never the bottleneck.
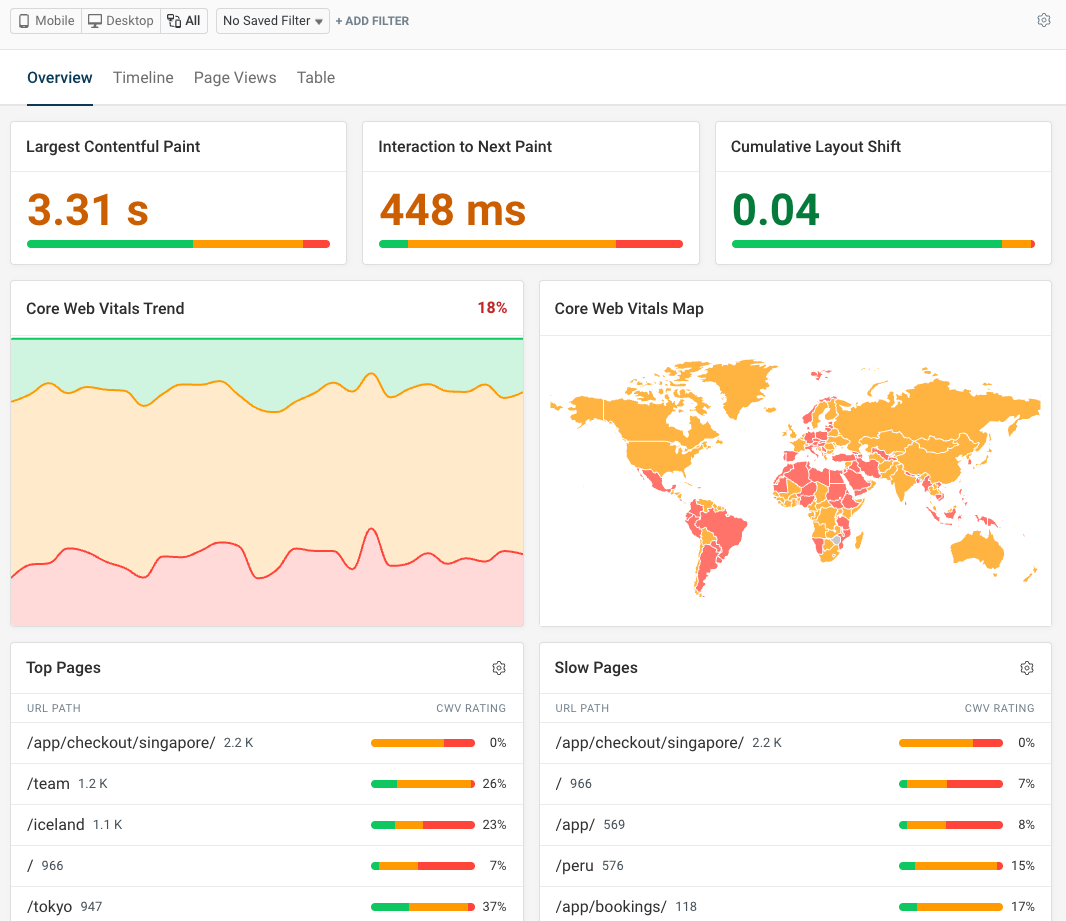
Google's Web Vitals are the industry's shared language; three metrics are enough: LCP (Largest Contentful Paint — when the main first-screen content appears, target < 2.5s), INP (Interaction to Next Paint — replaced the old FID, target < 200ms), CLS (Cumulative Layout Shift — how much the page jumps around, target < 0.1). LCP covers "does it open fast," INP covers "does it feel responsive," CLS covers "does the layout jump."
Pick your tool by scenario. Lighthouse is the starting point: built into Chrome DevTools, one run gives you four scored dimensions plus concrete suggestions — use it for local debugging. Note its numbers are lab data — idealized hardware and network — so don't treat them as production truth. PageSpeed Insights is the online version of the same engine: enter a URL, get results, plus real-user CrUX data if your traffic is large enough — use it for before/after comparisons. Vercel Speed Insights is continuous monitoring: one click on a Vercel project, and every real visit afterwards is recorded, so regressions surface immediately.
Practical advice: go run Lighthouse now, write down four numbers — LCP, INP, CLS, first-screen JS size — and save a screenshot. That's your baseline. Run it again after optimizing and compare — an optimization report without comparison data is superstition. One more tip: run Lighthouse three times and take the median; single runs vary wildly, don't let one outlier mislead you.
The number-one trap: images, the performance killer of 90% of vibe sites
Rule of thumb: if your vibe site loads slowly, check images first — that's where the problem is eight times out of ten. One unprocessed photo is often 20–50x the size of an optimized one, and this is the cheapest fix on the list.
On Next.js, use next/image instead of raw <img>. It does three things automatically: generates multiple responsive sizes per device, converts to modern formats like WebP/AVIF, and lazy-loads by default (below-the-fold images load only when scrolled to). Three usage rules: always set width/height or use fill with a sized parent (prevents CLS jumps), add priority to the above-the-fold hero (tells the browser to load it first), pair it with a blur placeholder (placeholder="blur" shows a blurred color block while loading — much better feel).
Not on Next.js? The principles transfer: batch-convert at build time with sharp (Node) or squoosh into AVIF/WebP at sane dimensions; use native lazy loading loading="lazy" in markup; hard-code aspect ratios on <img>. Vite projects can use vite-imagetools to auto-generate multi-size variants at build time.
Three iron rules, worth taping to your monitor: one, never use a 4K original as the hero — anything wider than 1920px for a hero is waste; squeeze it to 1600px wide in AVIF and it typically drops from 8MB to under 150KB with no visible difference. Two, serve every image from a CDN — Cloudflare, Vercel, or any object storage with CDN; edge caching plus automatic format negotiation (AVIF for browsers that support it) is free performance. Three, decorative small graphics belong in SVG/CSS, not bitmaps — icons, gradients, simple illustrations as SVG; every PNG you skip saves tens of KB.
Don't do this: see the agent's <img src="/uploads/photo.jpg"> and ship it. First ask: how big is it? What format? Above the fold? If you can't answer all three, don't publish yet.
Slimming the frontend bundle: put your JS on a diet
Images fixed, next inspect JS size. The more JS on first paint, the longer parse and execution takes — especially on phones, where a mid-range Android needs 2–3 seconds to parse 1MB of JS, during which the page is dead.
Step one is always seeing the composition clearly, not deleting code by feel. Next.js projects run npx next-bundle-analyzer (install @next/bundle-analyzer first); Vite projects use rollup-plugin-visualizer. The build then produces a treemap where the biggest packages are obvious. Usual suspects in vibe projects: a component library imported whole (used only Button, shipped everything), moment/dayjs-style date libraries (dayjs is an order of magnitude smaller than moment), full echarts imports (on-demand imports cut more than half).
Once you've found the hogs, work in this priority order: one, split with dynamic import(). Anything not needed on first paint — modals, rich-text editors, charts, admin panels — becomes const Editor = dynamic(() => import('./Editor')) (Next.js), defineAsyncComponent (Vue), or React.lazy, loading only when needed. This is the fastest win, often cutting 30–50% of first-screen weight in one move. Two, verify tree-shaking actually works. Confirm ESM imports (import { Button } from 'antd', not the whole package) and that production minify is on; some libraries' CommonJS builds silently defeat tree-shaking, and switching to the ESM entry fixes it. Three, CDN what you can instead of bundling. Foundational libs like React or Vue, used across many pages, can ride a CDN with caching instead of being packed into every chunk — but do the math: an extra request is cheap under HTTP/2, yet if the CDN goes down your site goes down with it. Your call.
One more mistake agents love: fonts. Four or five weights of Google Fonts, hundreds of KB each. The fix is subsetting: Next.js next/font subsets and self-hosts automatically; manually, use fonttools to keep only the characters you use. For CJK sites it's more brutal — a Chinese font is several MB, so either use the system font stack or webfont only the headings, subsetted; body text in system fonts is indistinguishable to users.
Quantified target: first-screen JS under 200KB gzipped; 200–350KB is passing, over 500KB means you must act. It's one of the hard gates to a 90+ Lighthouse performance score.
The data layer: what N+1 queries look like, and how to fix them
Frontend slimmed but APIs still slow? The problem is likely the data layer. First learn to recognize the most classic slow query in AI-generated code:
Bad code (a high-frequency agent output): const posts = await db.post.findMany({ take: 50 }) followed by for (const p of posts) { p.author = await db.user.findUnique({ where: { id: p.authorId } }) } — one list query plus 50 per-row queries, 51 database hits. That's N+1: one primary query dragging N dependent queries behind it.
Fix per your ORM: Prisma uses include: { author: true } to fetch it in one join; Drizzle has its relational query builder; Django uses select_related / prefetch_related; SQLAlchemy uses joinedload; raw SQL just gets a JOIN. After fixing, turn on the ORM's query log and confirm the list page issues only 1–2 SQL statements — counting SQL statements is the only valid proof the fix worked, not "it feels faster."
Three more moves after N+1. First, indexes. Every field in a WHERE, ORDER BY, or JOIN condition deserves an index. Agents habitually index only the primary key and leave foreign keys and filter fields naked. Run EXPLAIN and look at the plan: full table scans (Seq Scan / ALL) are the missing-index signal. But don't swing to the other extreme: indexes slow down writes, so only read-heavy tables deserve many. Second, pagination. List endpoints always paginate — 20 per page by default; never return findMany() unconditionally. Agent-written admin pages love returning whole tables, and ten thousand rows will nuke memory and bandwidth together. Third, caching. Pick by scenario: rarely-changing content gets ISR (Next.js incremental static regeneration — revalidate: 60 regenerates a page at most once per 60 seconds); high-read low-write data gets Redis with versioned keys for easy invalidation; purely static content rides the CDN. The golden rule of caching: get the invalidation strategy right before celebrating the cache — a stale-data bug is worse than slowness.
Don't do this: throwing bigger machines or pricier database tiers at slow endpoints. 90% of slow endpoints are query-writing problems; upsizing just makes bad queries expensive. EXPLAIN first, money second.
Perceived performance in the AI era: streaming and skeletons
Vibe projects have a performance scenario traditional sites don't: calling LLM APIs. A user clicks a button, and the agent-generated backend dutifully waits for the model to finish all 2,000 words before returning anything. Staring at a spinner for 30 seconds feels ten times worse than a 3-second white screen — because a white screen at least says "loading," while a 30-second spinner says "is it frozen?"
The fix is streaming: SSE (Server-Sent Events) or fetch's ReadableStream, pushing tokens to the frontend as they're generated and rendering word by word. OpenAI and Anthropic SDKs both natively support stream: true; Next.js's AI SDK (the ai package) wraps it as streamText() + useChat() in a few lines of code. This is table stakes for AI apps, not a bonus — in 2026, an AI app that waits for the full response before rendering has a baseline UX gap.
Streaming solves the waiting; now fix how the waiting feels. Two moves: skeleton screens hold the layout — the page structure appears first with shimmering gray blocks meaning "content is on its way," far better perceived performance than white screen plus spinner; structure first, fill later — for AI-generated reports, stream the title and section outline first, then fill each section; users start reading at second 2 instead of seeing everything at second 30.
This generalizes to every slow operation: anything over 1 second needs progressive feedback. File uploads show progress bars (not just spinners), batch jobs show "12/50 done," long form submissions disable the button with updated copy. The essence of perceived performance: users don't mind waiting; they mind not knowing what they're waiting for or how much longer.
Don't do this: slapping a loading spinner on the LLM call and calling it done. Spinners are a 2015 solution; streaming plus skeletons is the passing bar for AI apps. Having the agent rewrite that "wait for the full response" code usually costs under half an hour.
The launch checklist: make performance a feature, not firefighting
Optimization done — now the final gate before launch. Check off every item below before shipping; paste it into your README or Notion:
□ LCP < 2.5s, INP < 200ms, CLS < 0.1 (measured on PageSpeed Insights mobile, not the Lighthouse lab score)
□ All images on CDN in AVIF/WebP; hero ≤1920px wide and ≤200KB each
□ First-screen JS < 200KB gzipped (confirmed via next-bundle-analyzer or Lighthouse's "avoid enormous network payloads")
□ All list endpoints paginated with relations fetched in one query (count SQL in the ORM log)
□ Hot-read endpoints have a caching strategy (ISR / Redis / CDN — pick one, and write down the invalidation rules)
□ All LLM calls stream; slow operations (>1s) have progressive feedback
□ Third-party scripts (analytics, chat widgets, ads) all async/defer or offloaded to a web worker via Partytown — never blocking first paint
□ Fonts load only the weights you use; CJK body text prefers the system font stack
One last workflow suggestion: put performance in CI instead of cramming before launch. Run Lighthouse CI on every PR and flag any LCP regression over 0.5s; keep Vercel Speed Insights monitoring real-user data with alerts on drops. Next time the agent adds a feature, have it run the checklist too — "new features must not grow LCP by more than 200ms." Write that into your AGENTS.md or project conventions; the agent will remember it better than you do.
Performance optimization isn't arcane. It's just taking every "well, it runs" corner of "it runs" code and making it "runs with care," one piece at a time. Vibe coders iterate fast: measure a baseline, change one thing, verify, and one afternoon can transform a slow site. Slowness isn't the original sin of vibe projects — knowing it's slow and never measuring is.
Related articles
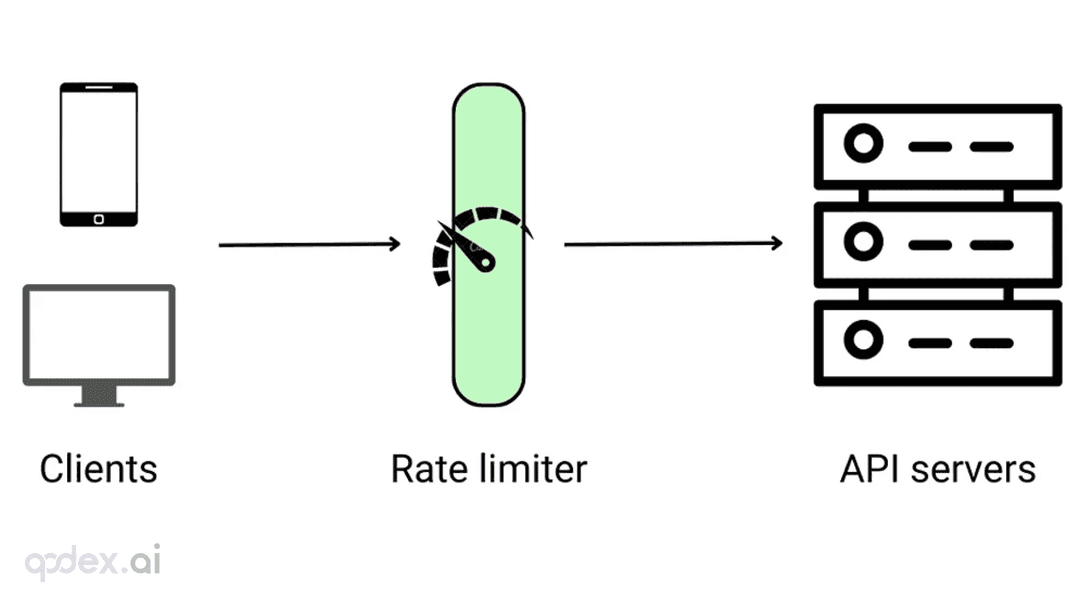
Every public endpoint will be called beyond your expectations some night. This guide builds a one-person-team rate-limiting system: algorithm choice (sliding window vs token bucket), four-layer defense, AI-endpoint money-burning protection, quota design, 429 response conventions, false-positive triage, and a launch checklist.
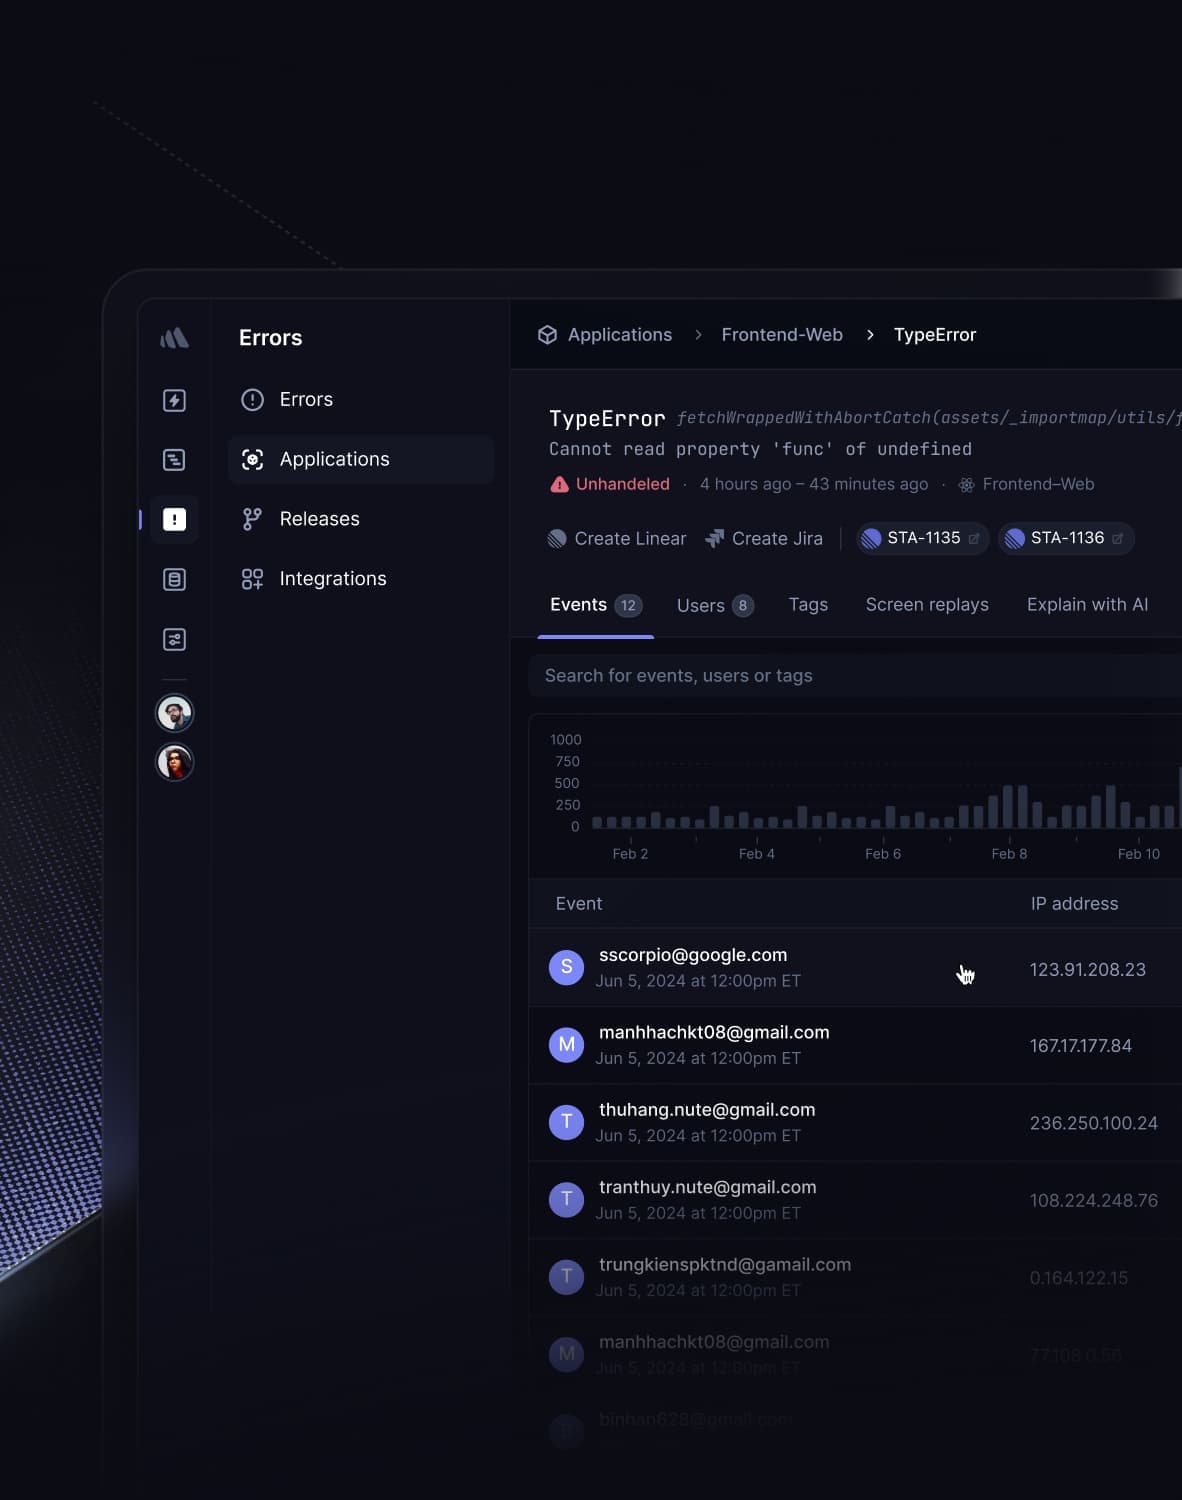
Every vibe project has the same darkly comic moment: your site goes white-screen and a friend tells you before your monitoring does. This guide builds a one-person-team error monitoring system: a 5-minute Sentry loop, error boundaries, report context design, backend structured logging, AI-call-specific protection, alert tiers, and a launch checklist.
Every vibe project hits the same moment: a list page firing a dozen DB queries per load, the database melting under modest traffic. This guide starts from the three-question caching mindset, then layers HTTP cache headers, Next.js data caching, Redis application caching with key design and the penetration/breakdown/avalanche defenses, and AI result caching (semantic cache, prompt caching), plus invalidation strategy and a launch checklist.