When AI-Generated Queries Kill Your Database: Index and Slow-Query Triage for Vibe Projects
Your API p99 went from 300ms to 3s after launch — the database is the culprit eight times out of ten. This guide gives you a closed-loop playbook: find the real offender with pg_stat_statements, read EXPLAIN in five minutes, pick B-tree/GIN/BRIN/partial/covering indexes by query shape, dodge the 6 classic slow-query traps in AI-generated code, and ship with CREATE INDEX CONCURRENTLY. A 15-minute weekly checklist included.

We already have three database guides on this site, each owning one question: the selection guide answers "which database to use," the migration guide answers "how to change the schema safely," and the backup guide answers "how to recover when data is lost." This is the fourth piece of the puzzle, and it answers the most painful post-launch question: the database is live, data keeps growing, queries keep getting slower, and your API p99 has climbed from hundreds of milliseconds to seconds — where do you start?
First, a harsh truth: AI-generated query code (Prisma, Drizzle, all the same) is correct when data is small — the logic works, the tests pass. But it almost never thinks about data volume: a list page that should fetch 20 rows does a full table scan, a filter that should use an index gets wrapped in a function, and pagination is always OFFSET. You feel nothing until ~100k rows, and past that point slow queries start popping up one after another. This guide skips database theory and gives you a closed loop you can run verbatim:
 Figure 1: The slow-query triage loop. Fix only the Top 1 slow query per round; run the full loop before starting the next one — people who try to fix everything at once end up verifying nothing.
1. Symptom check: how to know the database is the slow part
Your API got slow — don't rush to add indexes. Step one is confirming the blame actually belongs to the database. Misdiagnosing costs you an afternoon in the wrong direction.
Watch p99, not the average. Average response time is the most deceptive metric there is: mix 10 five-second slow queries into 1,000 fifty-millisecond ones and the average only rises to ~100ms — looks "fine," while real users are already suffering. Open your monitoring (Sentry, Vercel Analytics, self-hosted Prometheus, whatever you use) and look at the p95/p99 curves. If p99 climbs from 300ms to 2–3 seconds while p50 doesn't move at all, that's the classic "a few slow queries dragging down everything" shape, and the database is the culprit eight times out of ten.
Catch the real offender with pg_stat_statements. This is PostgreSQL's slow-query ledger: it aggregates by query template and tells you how many times each query ran and how much total time it ate. First make sure the extension is on:
CREATE EXTENSION IF NOT EXISTS pg_stat_statements;Then run this "Top 10 by total time" — it tells you directly what to fix first:
SELECT query, calls,
       round(total_exec_time::numeric, 1) AS total_ms,
       round(mean_exec_time::numeric, 1) AS mean_ms,
       round((100 * total_exec_time / sum(total_exec_time) OVER ())::numeric, 1) AS pct
FROM pg_stat_statements
ORDER BY total_exec_time DESC
LIMIT 10;
How to read this table: look at total_ms and pct (share of total time) first, then calls and mean_ms. A query with a 5ms mean that ran 2 million times (the classic N+1 shape) can outspend a 2-second report query that runs a few times a day in total time. Fix in total_ms order — it's very common for the Top 3 to eat over 50% of total time. Kill those three and p99 drops immediately. Note that parameters in the query column are normalized to $1, $2, so each template appears once — exactly the aggregation you want.
Turn on the slow-query log as your sentry. log_min_duration_statement is a PostgreSQL setting: any statement slower than the threshold gets logged with duration: 2341.502 ms attached. Recommended values: 1000 (ms) right after launch, tighten to 500 once stable. Supabase, Neon, Railway all expose this switch directly in their dashboards — no config files needed. The log's value is early detection: p99 curves lag, the slow-query log is real time.
Finally, a three-condition rule — only act when all three hold: ① API p99 is climbing; ② database CPU or I/O is climbing in the same window (visible in any hosted dashboard); ③ the slow-query log / pg_stat_statements shows specific, repeating SQL. If ① holds but ② and ③ don't, the slowness is probably in the app layer (external API calls, image processing, …) — leave the database alone.
If you're on Supabase / Neon / Railway: all three of these have ready-made entries in the dashboard, no DIY needed. Supabase's Database → Query Performance gives you a slow-query leaderboard plus index suggestions; Neon shows compute CPU curves under Monitoring; Railway's Postgres plugin page has the slow-query log switch. Skim these free panels first — half the time they point at the culprit without you writing any SQL. Self-hosted Postgres folks need to install the extension and set the log parameter manually — but the principles are identical.
2. EXPLAIN (ANALYZE, BUFFERS): reading execution plans in five minutes
Once you've locked onto a suspect query, look at its execution plan — how the database actually runs it. One line to memorize:
EXPLAIN (ANALYZE, BUFFERS, TIMING OFF)
SELECT * FROM orders WHERE user_id = 'abc' ORDER BY created_at DESC LIMIT 20;
ANALYZE means really run it (not just plan), BUFFERS shows cache hits, TIMING OFF removes timing overhead for cleaner numbers. Warning: ANALYZE truly executes — never wrap it directly around UPDATE/DELETE; use BEGIN; EXPLAIN ANALYZE ...; ROLLBACK; instead.
You only need to read four lines of the output:
Seq Scan on orders— full table scan. Fine for a few thousand rows; on a hot table with 100k+ rows it's basically a red light. Its opposites areIndex Scan using idx_orders_user_id(used an index) andBitmap Heap Scan(index + heap fetch).Rows Removed by Filter: 98200— the most informative line in the whole plan. It means the database scanned 100k rows, threw away 98,200, and kept 1,800. A large number here means the filter has no usable index, or the condition is written in a way that defeats the index. Your first reaction should be "missing index," not "too much data."Buffers: shared hit=12 read=845— cache behavior.hit= read from memory,read= read from disk. Ifreaddominates, "slow the first time, fast the second time" is probably a cold cache, not an index problem — don't rush to build indexes; confirm it's not a cold start.- Estimated vs actual rows.
rows=100in the plan is the planner's estimate;actual rows=50000is what really happened. If they differ by 10x or more, runANALYZE orders;to refresh statistics before building any index — a planner working from stale data will pick the wrong plan no matter what indexes you add.
Here's what a real before/after looks like. An orders table with 500k rows, fetching one user's latest 20 orders:
-- Before: Seq Scan, Execution Time: 812.4 ms
Seq Scan on orders  (cost=0.00..12842.00 rows=1820 width=96)
  (actual time=0.031..798.112 rows=1820 loops=1)
  Filter: (user_id = 'abc')
  Rows Removed by Filter: 498180
  Buffers: shared hit=1240 read=6120

-- After adding a (user_id, created_at DESC) composite index: Execution Time: 0.8 ms
Limit  (cost=0.42..8.45 rows=20 width=96)
  (actual time=0.021..0.742 rows=20 loops=1)
  -> Index Scan using idx_orders_user_created on orders
       Index Cond: (user_id = 'abc')
       Buffers: shared hit=24
800ms to 0.8ms — a 1000x difference from a single correctly-built index. That's why slow-query tuning has absurd ROI: no refactor, no database swap; most of the time you just need one right index. But "right" is exactly what the next section is about.
3. Index decision flow: which of the five index types goes where
PostgreSQL has more than one index type, and "missing an index" and "which index to build" are two different questions. The decision order is always: look at what the query looks like first, then pick the index type — doing it the other way around (build first, ask later) is the root of all index bloat.
 Figure 2: Index type decision. The default B-tree covers 90% of queries; the other four are specialists for specific query shapes — don't hand them out like cold medicine.
- B-tree (the default): equality, range, sorting — covers 90% of cases. If you don't specify a type,
CREATE INDEXbuilds a B-tree. Column order in composite indexes has a mnemonic: equality columns first, range columns last. ForWHERE user_id = ? AND created_at > ? ORDER BY created_at DESC, the index should be(user_id, created_at DESC)—user_idis the equality column, up front;created_atdoes range + sort, behind it. Reverse the order and the sort can't use the index. In Prisma:@@index([userId, createdAt(sort: Desc)]). - Partial index: you only ever query a small slice of rows. Classic case:
WHERE status = 'active'where active rows are 5% of the table.CREATE INDEX idx ON orders (user_id) WHERE status = 'active';— the index only contains those 5% of rows: tiny, fast, low write amplification. The query's WHERE must include the same predicate or the planner won't use it. - GIN index: JSONB, arrays, full-text search. AI loves stuffing "fields we might need later" into JSONB, and one day someone writes
WHERE meta->>'plan' = 'pro'and the full scan runs forever. Fix:CREATE INDEX idx ON users USING gin (meta jsonb_path_ops);. Full-text search (to_tsvector) goes to GIN too. - BRIN index: log/append-only tables that are naturally ordered. BRIN doesn't store per-row positions, only "roughly what range this block holds" — the index can be 1% the size of a B-tree. The price: it only suits columns where insertion order equals physical order, like
created_at. Don't use it on tables with out-of-order writes. - Covering index (INCLUDE): the query only needs a few columns and you want to avoid the heap fetch.
CREATE INDEX idx ON orders (user_id) INCLUDE (total, status);—INCLUDEcolumns don't participate in filtering or sorting, they just "come along for the ride," lettingSELECT user_id, total, status WHERE user_id = ?read only the index. Best for hot, narrow, read-heavy queries.
Two "don't bother" rules: ① skip indexes on tables under ~10k rows — a full scan takes milliseconds there, and index maintenance costs more than it saves; ② one query gets one index — don't pile on five single-column indexes hoping the planner picks well. It often picks wrong; a composite index is the right answer.
4. The 6 classic slow-query traps in AI-generated code
This is the most bookmark-worthy section of the guide. Slow AI-generated queries come from a highly concentrated set of causes — these six traps cover 90%+ of cases. Each trap gets three things: what it looks like, how to spot it, the minimal fix.
Trap 1: N+1 queries. The shape: fetch 100 orders, then query the user once per order inside a loop. Prisma's include is implemented as multiple SQL statements, so querying inside a loop on top of it is N+1. Detection signal: in pg_stat_statements one query has tens or hundreds of times the calls of everything else, but a tiny mean_ms — each call is fast, there are just too many of them. Fix: fetch everything at once — Prisma's include in a single shot, Drizzle relational queries or batched inArray.
// Trap: querying in a loop (100 orders = 101 queries)
for (const o of orders) { o.user = await db.user.findUnique({ where: { id: o.userId } }); }

// Fix: fetch at once (2 queries)
const orders = await db.order.findMany({ include: { user: true } });
Trap 2: SELECT *. AI fetches every column by default, including the content text column you never use. A row balloons from a few KB to tens of KB; bandwidth and memory suffer together, worst on list pages. Fix: explicitly select only the columns you use. Prisma: select: { id: true, title: true, createdAt: true }; Drizzle: pick only needed columns likewise.
Trap 3: deep OFFSET pagination. OFFSET 100000 LIMIT 20 looks like it fetches 20 rows, but the database scans and discards the first 100k rows — deeper pages, slower queries. Fix: keyset (cursor) pagination, using the last row's sort key as the cursor:
-- Trap: OFFSET 100000 LIMIT 20 (slower the deeper you go)
-- Fix: cursor pagination (index seek every time, stable few ms)
SELECT * FROM orders
WHERE (created_at, id) < ('2026-10-01 00:00:00', 'ord_999')
ORDER BY created_at DESC, id DESC
LIMIT 20;
The row-value comparison (created_at, id) needs a matching composite index (created_at DESC, id DESC); id is there for stable ordering when created_at ties.
Trap 4: functions on columns kill indexes. WHERE lower(email) = ?, WHERE DATE(created_at) = ? — wrap a column in a function and the B-tree index (which stores raw values) can't be used. Two fixes: ① an expression index, CREATE INDEX idx ON users (lower(email));; ② rewrite the query, e.g. DATE(created_at) = '2026-10-15' becomes created_at >= '2026-10-15' AND created_at < '2026-10-16', which can also use a range index.
Trap 5: implicit type conversion. The column is bigint but the query passes the string '123'; PostgreSQL converts the column to text before comparing, and the index dies. Prisma's queryRaw parameters and raw URL query strings used as conditions are the worst offenders. Fix: keep parameter types aligned with column types — convert with BigInt(id) where needed, don't be lazy.
Trap 6: OR conditions. WHERE a = ? OR b = ? — the planner often gives up on indexes entirely and full-scans (it must satisfy both branches optimally). Fix: split into UNION ALL of two queries that each use their index, or make sure both branches are indexed so the planner can use BitmapOr — but BitmapOr's conditions are finicky; splitting the query is more reliable:
-- Trap: OR causes a full scan
SELECT * FROM posts WHERE author_id = 'u1' OR reviewer_id = 'u1';
-- Fix: UNION ALL, each branch uses its own index
SELECT * FROM posts WHERE author_id = 'u1'
UNION ALL
SELECT * FROM posts WHERE reviewer_id = 'u1';
Self-check method: print these six traps and tape them next to your monitor. Run through them every time AI writes query code for you — ten times cheaper than firefighting later.
5. The safe way to add indexes in production
Index chosen — now it's about getting it live safely. Here's the landmine beginners step on: plain CREATE INDEX locks the table — writes to the table block while the index builds. On a few thousand rows it finishes in a blink and you never notice; on a production table with hundreds of thousands of rows, a minutes-long lock means "the submit button spins" for your users.
The safe procedure is three steps, in order:
- Build with
CREATE INDEX CONCURRENTLY. It doesn't block writes; the price is a slower build (usually 1–2x) and it cannot run inside a transaction block — Prisma migrate and Drizzle migrate wrap migrations in transactions by default, so don't add indexes on large production tables via normal migrations; run them manually against the database. Run during off-peak and watch it finish. - Run
ANALYZEto refresh statistics. After the new index is built, the planner doesn't know how good it is yet;ANALYZE tablename;re-samples so the planner can see it. Otherwise you get the haunted "index built but the plan still full-scans" phenomenon. - Verify the index is actually working. Check
pg_stat_user_indexesto see the new index'sidx_scanclimbing, and confirm the SQL no longer appears in the slow-query log. Ifidx_scanis still 0 after three days, you built the wrong index — go back to section 2 and re-read the plan.
-- The standard production recipe (run manually in psql, NOT in a transaction)
CREATE INDEX CONCURRENTLY idx_orders_user_created
  ON orders (user_id, created_at DESC);
ANALYZE orders;

-- Check for broken indexes left by failed CONCURRENTLY builds
-- (indisvalid = false means broken: drop it and retry)
SELECT indexrelid::regclass AS index_name, indisvalid
FROM pg_index WHERE NOT indisvalid;

-- Verify the new index is being used
SELECT indexrelname, idx_scan FROM pg_stat_user_indexes
WHERE indexrelname = 'idx_orders_user_created';
Prisma/Drizzle users take note: adding @@index in the schema generates a migration with a plain CREATE INDEX. When the production table is already large, the correct move is: manually build the same-named index with CONCURRENTLY first, then run the migration (it will see the index exists and skip it, or use --create-only and hand-edit the index statement). Never let a migration tool lock your production table.
If a CONCURRENTLY build dies halfway (say the connection drops), it leaves an indisvalid broken index behind: it occupies the name and the disk space, but the planner will never use it. Don't just re-run — first DROP INDEX CONCURRENTLY bad_index_name; to clean up, then rebuild. The pg_index query above tells you whether it's broken. Also note that CONCURRENTLY needs two "quiet points" with no concurrent transactions on tables with heavy writes; on a big table an hour-long build is normal. Don't kill it because it looks slow — killing it leaves the broken index, which is worse.
6. More indexes ≠ better: write amplification and zombie indexes
AI has a bad habit: adding an index for every foreign key and every where condition it touches. Indexes trade write performance for read performance — every extra index means every INSERT/UPDATE/DELETE writes one more copy. That's write amplification. A table with 8 indexes writes 9 copies of the data on every write. Fine for read-heavy config tables; on write-heavy tables like orders or logs, too many indexes slow down writes directly.
Finding "zombie indexes" (built but never used) takes one query:
SELECT schemaname || '.' || relname AS table_name,
       indexrelname AS index_name,
       pg_size_pretty(pg_relation_size(indexrelid)) AS index_size,
       idx_scan
FROM pg_stat_user_indexes
WHERE idx_scan = 0
  AND indexrelid NOT IN (SELECT indexrelid FROM pg_index WHERE indisunique)
ORDER BY pg_relation_size(indexrelid) DESC;
Three caveats: ① exclude unique indexes (indisunique) — unique constraints are correctness guarantees, not performance indexes; never drop those; ② don't rush to drop freshly built indexes or ones after a stats reset (pg_stat_reset()) — observe a full business cycle (at least two weeks); ③ before dropping, confirm no query depends on it — cross-check the index name against your slow-query Top 10.
Rule of thumb: any table with more than 5 indexes deserves an audit. Ask three questions: which query does this index serve? Is that query still running? Can two single-column indexes merge into one composite? Most index bloat in vibe projects comes from two sources — "AI added it casually" and "leftover from early queries." A periodic cleanup wins back write performance and disk space.
7. The 15-minute weekly inspection checklist
Built indexes don't stay optimal forever: data distributions shift, new features bring new queries, and AI keeps casually adding indexes. Spend 15 minutes a week on this checklist and catch problems before p99 spikes:
- Any new faces in the slow-query Top 10. Run the pg_stat_statements query from section 1 and diff against last week: new entries get looked at first; anything in the Top 3 eating over 50% of total time must be handled.
- How many new distinct SQL templates hit the slow log this week. New features are the most common source of fresh slow queries; the log is the earliest sentry.
- Has seq_scan share drifted?
SELECT relname, seq_scan, idx_scan FROM pg_stat_user_tables ORDER BY seq_scan DESC;— if some table'sseq_scanexploded within a week, a query isn't using its index; go read its plan (section 2). - Are statistics fresh? Hot tables whose
last_analyze/last_autoanalyzeis older than 7 days get a manualANALYZE. Tables with shifting distributions (e.g. orders after a big sale) routinely outrun auto-analyze. - Flag zombie indexes. Run the section-6 query; non-unique indexes with
idx_scan = 0get flagged for observation — still 0 after two weeks, drop them. - Spot-check table bloat.
SELECT relname, n_dead_tup FROM pg_stat_user_tables ORDER BY n_dead_tup DESC;— tables drowning in dead tuples meanVACUUMisn't keeping up, and no index saves a bloated table. - Set the alert threshold. Alert when p99 exceeds 1 second for 10 minutes straight, linked straight to the slow-query log. A checklist without alerts is no checklist at all.
One sentence to close: slow-query tuning isn't a one-time project, it's a looping habit — detect, locate, fix, verify, inspect, every week. The faster AI writes code for you, the more you need this braking system: once data volume is up, the game isn't who ships more features, it's whose p99 stays flat. Starting today: turn on log_min_duration_statement, put 15 minutes on your calendar each week — three months from now you'll thank yourself.
P.S. Three queries for your toolbox — pull them out the next time p99 spikes: slow-query Top 10 (section 1), zombie indexes (section 6), seq_scan drift (section 7). A toolbox needs three well-worn queries, not thirty bookmarked tutorials.
Comments (0)
Related articles
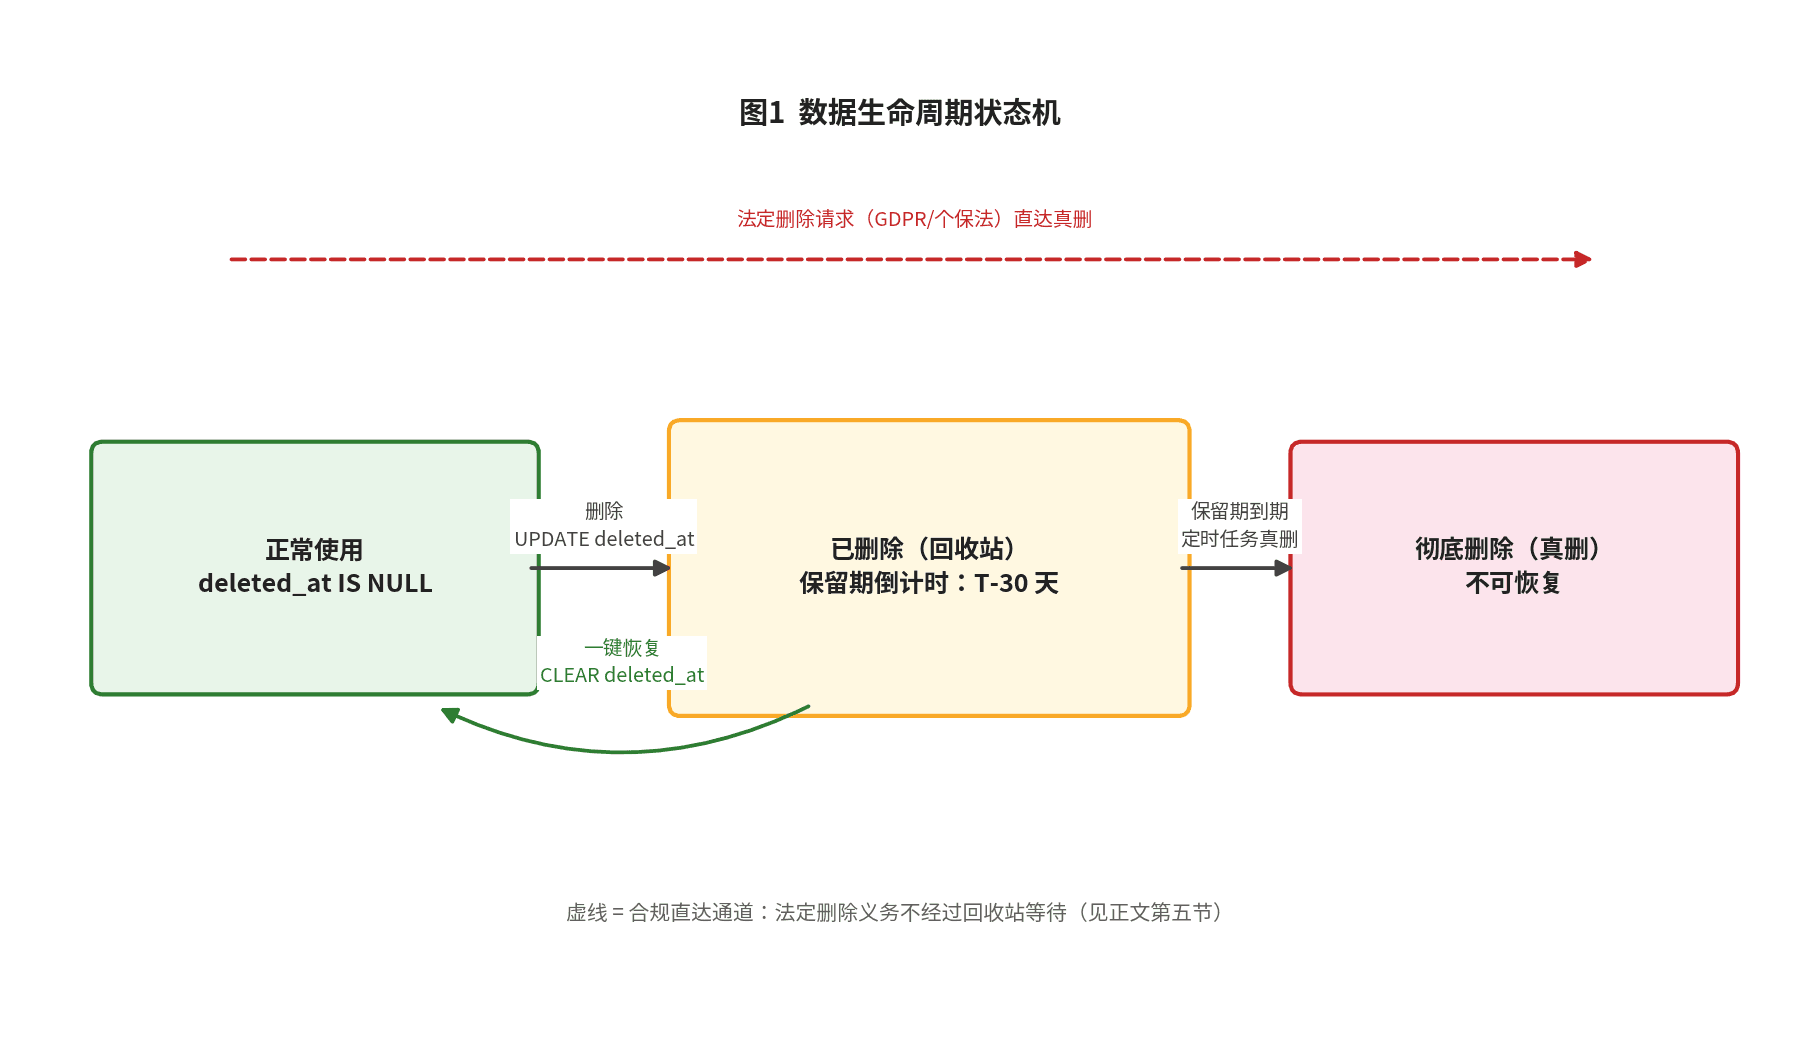
Backups are the last line of defense; the trash bin is the first. This hands-on guide covers the three delete semantics, deleted_at data modeling, partial unique indexes, Prisma query-layer guards, tiered trash-bin retention, GDPR/PIPL erasure reconciliation, and an 8-item launch checklist.

Avatars in ./uploads blew up in week one? This guide covers presigned-URL direct uploads, three storage policies for public/private/image-variant files, zero-egress selection with R2, orphan cleanup, environment isolation, and migration — with a launch checklist.
No ML team? No problem: rule-based ranking ships on day one, collaborative filtering kicks in after a few hundred events, vector retrieval joins when content scales — a three-stage roadmap with copy-paste SQL and scripts, plus cold-start tactics and 8 pitfalls.